
Advertisement
- France
- /
- Healthcare Services
- /
- ENXTPA:CLARI
Clariane (EPA:CLARI shareholders incur further losses as stock declines 12% this week, taking five-year losses to 89%

While not a mind-blowing move, it is good to see that the Clariane SE (EPA:CLARI) share price has gained 19% in the last three months. But will that repair the damage for the weary investors who have owned this stock as it declined over half a decade? Probably not. Like a ship taking on water, the share price has sunk 94% in that time. It's true that the recent bounce could signal the company is turning over a new leaf, but we are not so sure. The million dollar question is whether the company can justify a long term recovery. While a drop like that is definitely a body blow, money isn't as important as health and happiness.
Given the past week has been tough on shareholders, let's investigate the fundamentals and see what we can learn.
View our latest analysis for Clariane
While the efficient markets hypothesis continues to be taught by some, it has been proven that markets are over-reactive dynamic systems, and investors are not always rational. One flawed but reasonable way to assess how sentiment around a company has changed is to compare the earnings per share (EPS) with the share price.
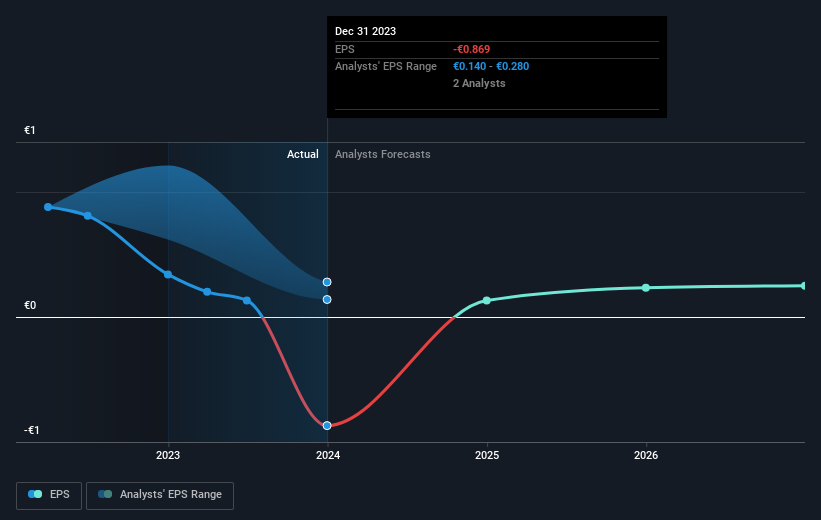
Over five years Clariane's earnings per share dropped significantly, falling to a loss, with the share price also lower. This was, in part, due to extraordinary items impacting earnings. At present it's hard to make valid comparisons between EPS and the share price. But we would generally expect a lower price, given the situation.
The company's earnings per share (over time) is depicted in the image below (click to see the exact numbers).
Before buying or selling a stock, we always recommend a close examination of historic growth trends, available here.
What About The Total Shareholder Return (TSR)?
We've already covered Clariane's share price action, but we should also mention its total shareholder return (TSR). The TSR attempts to capture the value of dividends (as if they were reinvested) as well as any spin-offs or discounted capital raisings offered to shareholders. Its history of dividend payouts mean that Clariane's TSR, which was a 89% drop over the last 5 years, was not as bad as the share price return.
A Different Perspective
Clariane shareholders are down 51% for the year, but the market itself is up 2.0%. However, keep in mind that even the best stocks will sometimes underperform the market over a twelve month period. Regrettably, last year's performance caps off a bad run, with the shareholders facing a total loss of 14% per year over five years. We realise that Baron Rothschild has said investors should "buy when there is blood on the streets", but we caution that investors should first be sure they are buying a high quality business. I find it very interesting to look at share price over the long term as a proxy for business performance. But to truly gain insight, we need to consider other information, too. Consider for instance, the ever-present spectre of investment risk. We've identified 3 warning signs with Clariane (at least 2 which shouldn't be ignored) , and understanding them should be part of your investment process.
If you like to buy stocks alongside management, then you might just love this free list of companies. (Hint: many of them are unnoticed AND have attractive valuation).
Please note, the market returns quoted in this article reflect the market weighted average returns of stocks that currently trade on French exchanges.
New: AI Stock Screener & Alerts
Our new AI Stock Screener scans the market every day to uncover opportunities.
• Dividend Powerhouses (3%+ Yield)
• Undervalued Small Caps with Insider Buying
• High growth Tech and AI Companies
Or build your own from over 50 metrics.
Have feedback on this article? Concerned about the content? Get in touch with us directly. Alternatively, email editorial-team (at) simplywallst.com.
This article by Simply Wall St is general in nature. We provide commentary based on historical data and analyst forecasts only using an unbiased methodology and our articles are not intended to be financial advice. It does not constitute a recommendation to buy or sell any stock, and does not take account of your objectives, or your financial situation. We aim to bring you long-term focused analysis driven by fundamental data. Note that our analysis may not factor in the latest price-sensitive company announcements or qualitative material. Simply Wall St has no position in any stocks mentioned.
Have feedback on this article? Concerned about the content? Get in touch with us directly. Alternatively, email editorial-team@simplywallst.com
About ENXTPA:CLARI
Clariane
Provides care home, healthcare facilities and services, and shared living solutions in France, Germany, Benelux, Italy, Spain, and the United Kingdom.
Undervalued with moderate growth potential.
Similar Companies
Market Insights

Advertisement
Community Narratives
Scaling up in building materials with smart M&A and growing profitability
Fair Value US$2.77|30.0% undervalued
CM
Community Contributor
Hims: The Platform Powering Personalised Healthcare
Fair Value US$114.01|51.9% undervalued
BL
Community Contributor
Undervalued lottery company with strong fundamentals
Fair Value AU$15.00|34.5% undervalued
RO
Community Contributor
Proximus, transferring money from the impatient to the patient investor
Fair Value €16.62|55.1% undervalued
AX
Community Contributor