Investors in Sampo Oyj (HEL:SAMPO) have seen returns of 4.9% over the past year


Most people feel a little frustrated if a stock they own goes down in price. But in the short term the market is a voting machine, and the share price movements may not reflect the underlying business performance. The Sampo Oyj (HEL:SAMPO) is down 10% over a year, but the total shareholder return is 4.9% once you include the dividend. That's better than the market which declined 8.7% over the last year. Longer term shareholders haven't suffered as badly, since the stock is down a comparatively less painful 1.1% in three years.
So let's have a look and see if the longer term performance of the company has been in line with the underlying business' progress.
View our latest analysis for Sampo Oyj
While the efficient markets hypothesis continues to be taught by some, it has been proven that markets are over-reactive dynamic systems, and investors are not always rational. One way to examine how market sentiment has changed over time is to look at the interaction between a company's share price and its earnings per share (EPS).
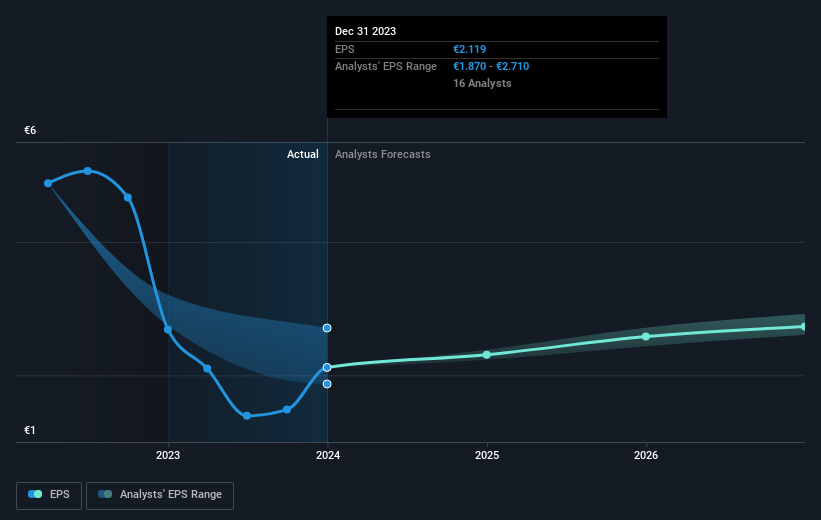
Unhappily, Sampo Oyj had to report a 21% decline in EPS over the last year. The share price fall of 10% isn't as bad as the reduction in earnings per share. It may have been that the weak EPS was not as bad as some had feared.
The company's earnings per share (over time) is depicted in the image below (click to see the exact numbers).
We like that insiders have been buying shares in the last twelve months. Having said that, most people consider earnings and revenue growth trends to be a more meaningful guide to the business. This free interactive report on Sampo Oyj's earnings, revenue and cash flow is a great place to start, if you want to investigate the stock further.
What About Dividends?
As well as measuring the share price return, investors should also consider the total shareholder return (TSR). Whereas the share price return only reflects the change in the share price, the TSR includes the value of dividends (assuming they were reinvested) and the benefit of any discounted capital raising or spin-off. So for companies that pay a generous dividend, the TSR is often a lot higher than the share price return. In the case of Sampo Oyj, it has a TSR of 4.9% for the last 1 year. That exceeds its share price return that we previously mentioned. The dividends paid by the company have thusly boosted the total shareholder return.
A Different Perspective
It's nice to see that Sampo Oyj shareholders have received a total shareholder return of 4.9% over the last year. That's including the dividend. Having said that, the five-year TSR of 7% a year, is even better. Potential buyers might understandably feel they've missed the opportunity, but it's always possible business is still firing on all cylinders. While it is well worth considering the different impacts that market conditions can have on the share price, there are other factors that are even more important. Consider risks, for instance. Every company has them, and we've spotted 1 warning sign for Sampo Oyj you should know about.
Sampo Oyj is not the only stock that insiders are buying. For those who like to find winning investments this free list of growing companies with recent insider purchasing, could be just the ticket.
Please note, the market returns quoted in this article reflect the market weighted average returns of stocks that currently trade on Finnish exchanges.
If you're looking to trade Sampo Oyj, open an account with the lowest-cost platform trusted by professionals, Interactive Brokers.
With clients in over 200 countries and territories, and access to 160 markets, IBKR lets you trade stocks, options, futures, forex, bonds and funds from a single integrated account.
Enjoy no hidden fees, no account minimums, and FX conversion rates as low as 0.03%, far better than what most brokers offer.
Sponsored ContentNew: Manage All Your Stock Portfolios in One Place
We've created the ultimate portfolio companion for stock investors, and it's free.
• Connect an unlimited number of Portfolios and see your total in one currency
• Be alerted to new Warning Signs or Risks via email or mobile
• Track the Fair Value of your stocks
Have feedback on this article? Concerned about the content? Get in touch with us directly. Alternatively, email editorial-team (at) simplywallst.com.
This article by Simply Wall St is general in nature. We provide commentary based on historical data and analyst forecasts only using an unbiased methodology and our articles are not intended to be financial advice. It does not constitute a recommendation to buy or sell any stock, and does not take account of your objectives, or your financial situation. We aim to bring you long-term focused analysis driven by fundamental data. Note that our analysis may not factor in the latest price-sensitive company announcements or qualitative material. Simply Wall St has no position in any stocks mentioned.
About HLSE:SAMPO
Sampo Oyj
Engages in the provision of non-life insurance products and services in Finland, Sweden, Norway, Denmark, Estonia, Lithuania, Latvia, Spain, Gibraltar, Germany, the Netherlands, France, and the United Kingdom.
Excellent balance sheet with proven track record.

