Advertisement
Tryg (CPSE:TRYG) Margin Compression Challenges Premium Valuation Despite Intrinsic Value Upside

Simply Wall St
Reviewed by Simply Wall St
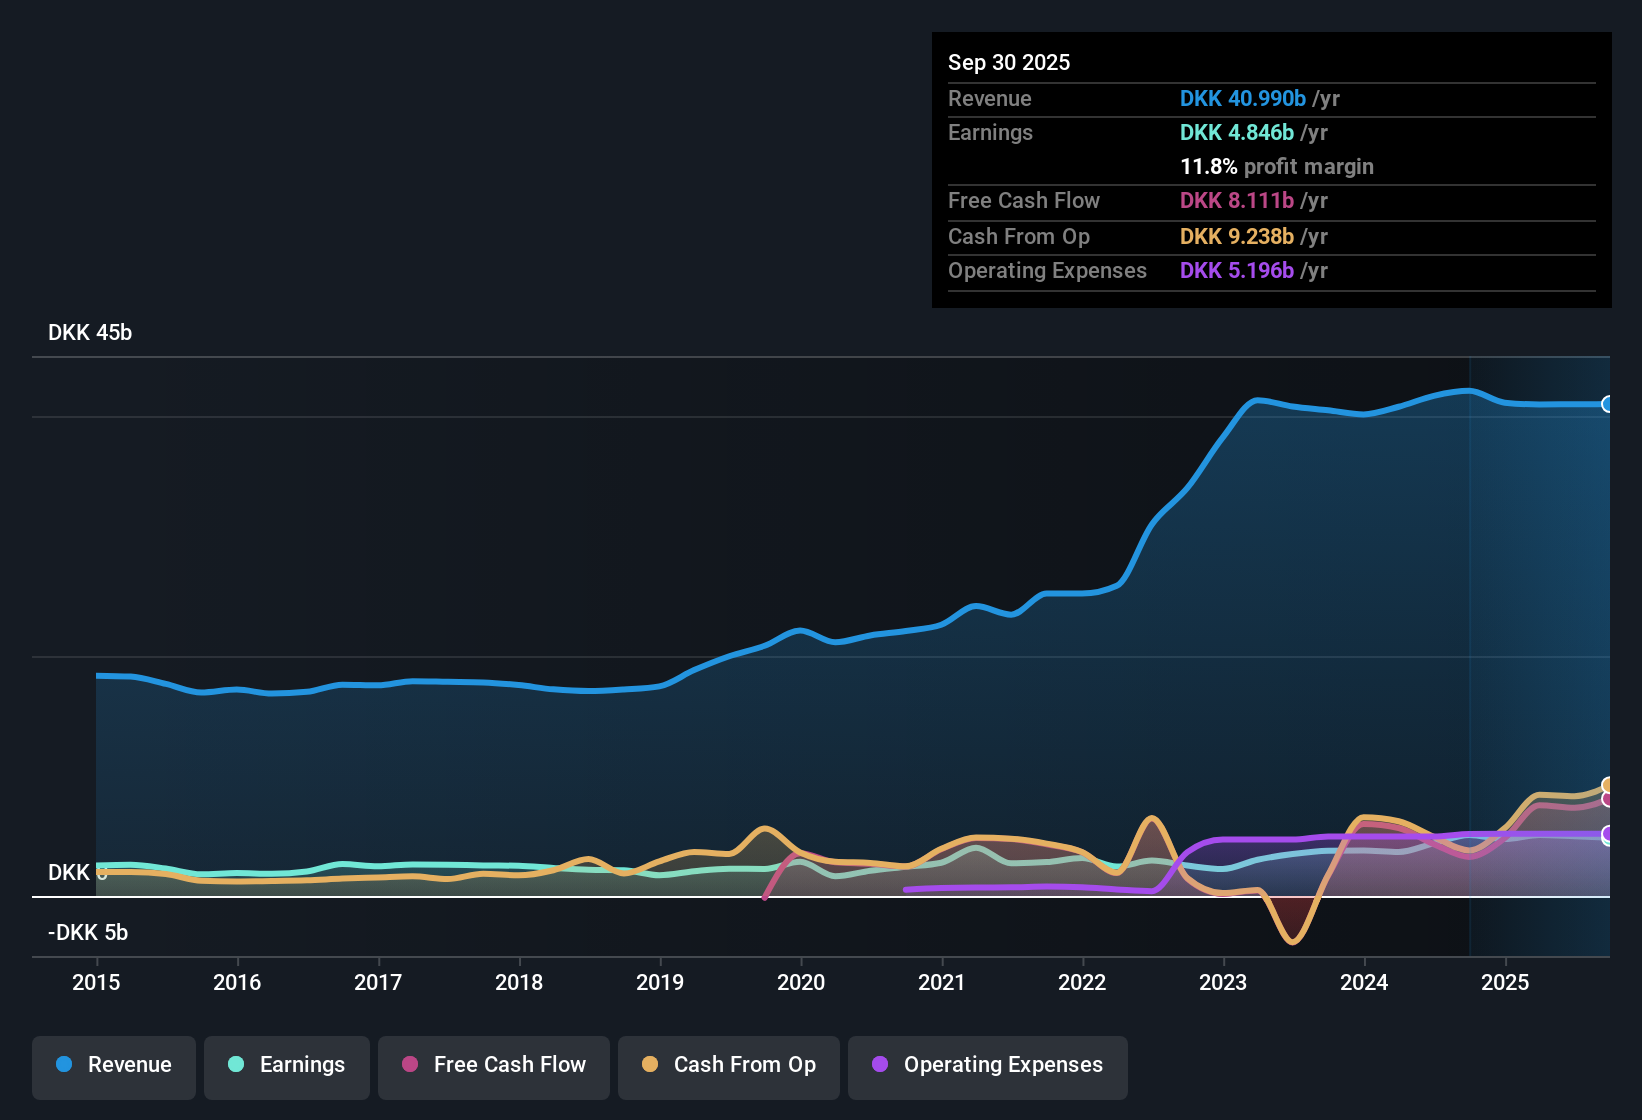
Tryg (CPSE:TRYG) posted a net profit margin of 11.8%, down from 12.1% a year ago, reflecting year-over-year margin compression. While earnings had averaged a healthy 14.1% annual growth rate over the last five years, the most recent full-year results marked a reversal with negative growth recorded. Looking ahead, analysts are forecasting 4.7% annual earnings growth, just ahead of Denmark’s 4% market pace. However, revenue growth is expected to lag the wider market at 2.9% compared to 5.5%.
See our full analysis for Tryg.Now, let's see how these latest numbers line up with the current community and market narratives. Some perspectives are bound to be confirmed, while others might get a reality check.
See what the community is saying about Tryg
Digitalization Drives Margin Recovery Efforts
- TRYG's profitability initiatives are projected to improve net profit margins from 12.1% to 12.9% over the next three years, according to analyst estimates.
- Analysts' consensus view notes these targeted margin gains are heavily supported by investments in digitalization and automation designed to streamline operations, lower the expense ratio, and tackle inflation-driven cost pressures.
- Efforts in the Private and Motor segments highlight management’s focus on operational efficiencies as a lever for sustained earnings stability. This directly addresses competitive challenges and regulatory scrutiny, which are cited as potential risks.
- Notably, there is an expectation for margin improvement despite ongoing inflationary pressures and increased claims costs in motor insurance, with forecasts anchored in quantifiable efficiency gains.
- To see how margin expansion plays into the consensus outlook and remaining risks, check out the full analyst narrative for Tryg. 📊 Read the full Tryg Consensus Narrative.
P/E Ratio Commands a Sector Premium
- TRYG’s current price-to-earnings ratio of 20.5x is notably higher than the European insurance peer average of 16.5x and the industry average of 12.8x, reflecting a significant sector premium.
- The consensus narrative questions whether this premium is justified given TRYG’s lower revenue growth forecast of 2.9% versus the Danish market’s 5.5%. However, it finds some validation in expected ongoing profit and capital management strategies.
- The company’s high quality past earnings and capital repatriation plans support investor optimism. Still, the premium valuation raises the bar for future earnings and operational delivery, especially against a backdrop of limited commercial growth.
- Consensus cautions that trading at this valuation will require TRYG to maintain its margin improvements while also addressing potential revenue growth challenges from heightened competition and regulatory developments.
DCF Fair Value Signals Deep Discount
- TRYG is priced at DKK165.0 per share, considerably below its DCF fair value estimate of DKK244.87. This suggests substantial upside based on discounted cash flow methodology.
- According to consensus narrative, this wide discount presents a compelling counterpoint to the stock’s higher P/E ratio. Intrinsic value models heavily favor the longer-term bullish case provided operational forecasts are met.
- Consensus highlights that analysts’ price target sits at DKK174.75, only 5.7% above the current price, which implies that while the market values near-term risks, longer-term models argue there may be significant value overlooked.
- This gap between DCF-derived fair value, analyst targets, and present share price underlines market caution. It also supports the thesis that forward margin execution could unlock meaningful upside for patient investors.
Next Steps
To see how these results tie into long-term growth, risks, and valuation, check out the full range of community narratives for Tryg on Simply Wall St. Add the company to your watchlist or portfolio so you'll be alerted when the story evolves.
Have a different angle on the latest figures? Take a few minutes to craft your own perspective and contribute your insights: Do it your way.
A great starting point for your Tryg research is our analysis highlighting 2 key rewards and 1 important warning sign that could impact your investment decision.
See What Else Is Out There
Despite efforts to boost efficiency, TRYG remains challenged by sluggish revenue growth, margin pressure, and a valuation premium that raises expectations for future performance.
If you want to prioritize steady top-line momentum and greater earnings reliability, take a look at our stable growth stocks screener to discover companies delivering consistent results across changing markets.
This article by Simply Wall St is general in nature. We provide commentary based on historical data and analyst forecasts only using an unbiased methodology and our articles are not intended to be financial advice. It does not constitute a recommendation to buy or sell any stock, and does not take account of your objectives, or your financial situation. We aim to bring you long-term focused analysis driven by fundamental data. Note that our analysis may not factor in the latest price-sensitive company announcements or qualitative material. Simply Wall St has no position in any stocks mentioned.
Valuation is complex, but we're here to simplify it.
Discover if Tryg might be undervalued or overvalued with our detailed analysis, featuring fair value estimates, potential risks, dividends, insider trades, and its financial condition.
Access Free AnalysisHave feedback on this article? Concerned about the content? Get in touch with us directly. Alternatively, email editorial-team@simplywallst.com
About CPSE:TRYG
Tryg
Provides insurance products and services for private and corporate customers, and small and medium-sized businesses in Denmark, Sweden, the United Kingdom, and Norway.
Excellent balance sheet average dividend payer.
Similar Companies
Market Insights

Advertisement
Community Narratives
A formidable player in AI and enterprise computing.
Fair Value US$210.00|12.2% overvalued
CO
Community Contributor
IREN's Bold Moves in Sustainable Bitcoin Mining & AI Data Centers
Fair Value US$72.52|17.1% undervalued
BL
Community Contributor
Cooling the Champions: The Aussie Tech Behind F1's Victories
Fair Value AU$12.40|38.7% undervalued
TR
Community Contributor