RealTech AG's (ETR:RTC) 25% Price Boost Is Out Of Tune With Revenues

Those holding RealTech AG (ETR:RTC) shares would be relieved that the share price has rebounded 25% in the last thirty days, but it needs to keep going to repair the recent damage it has caused to investor portfolios. Unfortunately, the gains of the last month did little to right the losses of the last year with the stock still down 22% over that time.
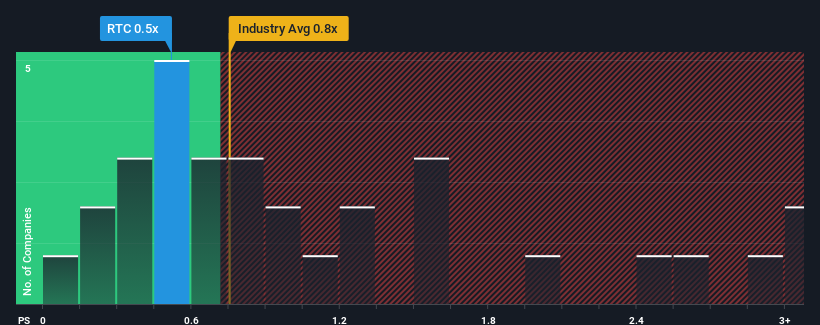
In spite of the firm bounce in price, you could still be forgiven for feeling indifferent about RealTech's P/S ratio of 0.5x, since the median price-to-sales (or "P/S") ratio for the IT industry in Germany is also close to 0.8x. However, investors might be overlooking a clear opportunity or potential setback if there is no rational basis for the P/S.
View our latest analysis for RealTech
How RealTech Has Been Performing
The recent revenue growth at RealTech would have to be considered satisfactory if not spectacular. It might be that many expect the respectable revenue performance to only match most other companies over the coming period, which has kept the P/S from rising. Those who are bullish on RealTech will be hoping that this isn't the case, so that they can pick up the stock at a lower valuation.
Although there are no analyst estimates available for RealTech, take a look at this free data-rich visualisation to see how the company stacks up on earnings, revenue and cash flow.What Are Revenue Growth Metrics Telling Us About The P/S?
In order to justify its P/S ratio, RealTech would need to produce growth that's similar to the industry.
If we review the last year of revenue growth, the company posted a worthy increase of 2.9%. The latest three year period has also seen a 6.6% overall rise in revenue, aided somewhat by its short-term performance. Therefore, it's fair to say the revenue growth recently has been respectable for the company.
This is in contrast to the rest of the industry, which is expected to grow by 9.2% over the next year, materially higher than the company's recent medium-term annualised growth rates.
With this information, we find it interesting that RealTech is trading at a fairly similar P/S compared to the industry. Apparently many investors in the company are less bearish than recent times would indicate and aren't willing to let go of their stock right now. Maintaining these prices will be difficult to achieve as a continuation of recent revenue trends is likely to weigh down the shares eventually.
What Does RealTech's P/S Mean For Investors?
RealTech appears to be back in favour with a solid price jump bringing its P/S back in line with other companies in the industry While the price-to-sales ratio shouldn't be the defining factor in whether you buy a stock or not, it's quite a capable barometer of revenue expectations.
Our examination of RealTech revealed its poor three-year revenue trends aren't resulting in a lower P/S as per our expectations, given they look worse than current industry outlook. Right now we are uncomfortable with the P/S as this revenue performance isn't likely to support a more positive sentiment for long. Unless there is a significant improvement in the company's medium-term performance, it will be difficult to prevent the P/S ratio from declining to a more reasonable level.
Before you settle on your opinion, we've discovered 3 warning signs for RealTech (2 make us uncomfortable!) that you should be aware of.
It's important to make sure you look for a great company, not just the first idea you come across. So if growing profitability aligns with your idea of a great company, take a peek at this free list of interesting companies with strong recent earnings growth (and a low P/E).
The New Payments ETF Is Live on NASDAQ:
Money is moving to real-time rails, and a newly listed ETF now gives investors direct exposure. Fast settlement. Institutional custody. Simple access.
Explore how this launch could reshape portfolios
Sponsored ContentNew: AI Stock Screener & Alerts
Our new AI Stock Screener scans the market every day to uncover opportunities.
• Dividend Powerhouses (3%+ Yield)
• Undervalued Small Caps with Insider Buying
• High growth Tech and AI Companies
Or build your own from over 50 metrics.
Have feedback on this article? Concerned about the content? Get in touch with us directly. Alternatively, email editorial-team (at) simplywallst.com.
This article by Simply Wall St is general in nature. We provide commentary based on historical data and analyst forecasts only using an unbiased methodology and our articles are not intended to be financial advice. It does not constitute a recommendation to buy or sell any stock, and does not take account of your objectives, or your financial situation. We aim to bring you long-term focused analysis driven by fundamental data. Note that our analysis may not factor in the latest price-sensitive company announcements or qualitative material. Simply Wall St has no position in any stocks mentioned.
About XTRA:RTC
RealTech
Provides information technology (IT) service management and SAP automation solutions in Germany and the Asia Paci?c.
Flawless balance sheet with reasonable growth potential.
Similar Companies
Market Insights

Weekly Picks

THE KINGDOM OF BROWN GOODS: WHY MGPI IS BEING CRUSHED BY INVENTORY & PRIMED FOR RESURRECTION


Why Vertical Aerospace (NYSE: EVTL) is Worth Possibly Over 13x its Current Price


The Quiet Giant That Became AI’s Power Grid
Recently Updated Narratives


MINISO's fair value is projected at 26.69 with an anticipated PE ratio shift of 20x

Fiverr International will transform the freelance industry with AI-powered growth

Stride Stock: Online Education Finds Its Second Act
Popular Narratives


MicroVision will explode future revenue by 380.37% with a vision towards success


Crazy Undervalued 42 Baggers Silver Play (Active & Running Mine)


