Could The Market Be Wrong About PUMA SE (ETR:PUM) Given Its Attractive Financial Prospects?

It is hard to get excited after looking at PUMA's (ETR:PUM) recent performance, when its stock has declined 8.5% over the past month. But if you pay close attention, you might gather that its strong financials could mean that the stock could potentially see an increase in value in the long-term, given how markets usually reward companies with good financial health. Specifically, we decided to study PUMA's ROE in this article.
ROE or return on equity is a useful tool to assess how effectively a company can generate returns on the investment it received from its shareholders. In other words, it is a profitability ratio which measures the rate of return on the capital provided by the company's shareholders.
Check out our latest analysis for PUMA
How Do You Calculate Return On Equity?
The formula for ROE is:
Return on Equity = Net Profit (from continuing operations) ÷ Shareholders' Equity
So, based on the above formula, the ROE for PUMA is:
12% = €334m ÷ €2.8b (Based on the trailing twelve months to March 2024).
The 'return' is the profit over the last twelve months. Another way to think of that is that for every €1 worth of equity, the company was able to earn €0.12 in profit.
What Has ROE Got To Do With Earnings Growth?
Thus far, we have learned that ROE measures how efficiently a company is generating its profits. Based on how much of its profits the company chooses to reinvest or "retain", we are then able to evaluate a company's future ability to generate profits. Generally speaking, other things being equal, firms with a high return on equity and profit retention, have a higher growth rate than firms that don’t share these attributes.
PUMA's Earnings Growth And 12% ROE
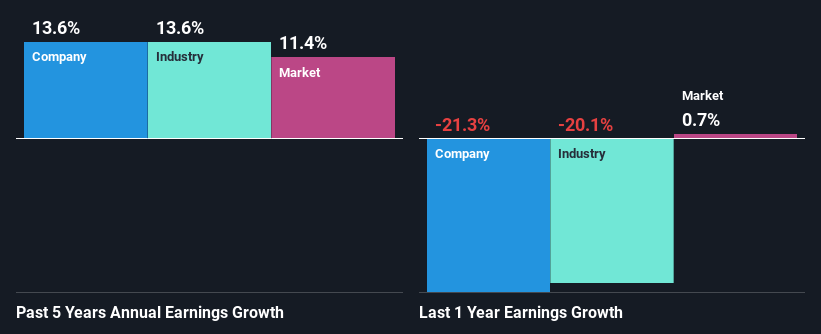
To begin with, PUMA seems to have a respectable ROE. Especially when compared to the industry average of 8.5% the company's ROE looks pretty impressive. This certainly adds some context to PUMA's decent 14% net income growth seen over the past five years.
Next, on comparing PUMA's net income growth with the industry, we found that the company's reported growth is similar to the industry average growth rate of 14% over the last few years.
Earnings growth is an important metric to consider when valuing a stock. What investors need to determine next is if the expected earnings growth, or the lack of it, is already built into the share price. This then helps them determine if the stock is placed for a bright or bleak future. Has the market priced in the future outlook for PUM? You can find out in our latest intrinsic value infographic research report.
Is PUMA Making Efficient Use Of Its Profits?
With a three-year median payout ratio of 35% (implying that the company retains 65% of its profits), it seems that PUMA is reinvesting efficiently in a way that it sees respectable amount growth in its earnings and pays a dividend that's well covered.
Additionally, PUMA has paid dividends over a period of at least ten years which means that the company is pretty serious about sharing its profits with shareholders. Upon studying the latest analysts' consensus data, we found that the company is expected to keep paying out approximately 37% of its profits over the next three years. Regardless, the future ROE for PUMA is predicted to rise to 17% despite there being not much change expected in its payout ratio.
Summary
In total, we are pretty happy with PUMA's performance. Particularly, we like that the company is reinvesting heavily into its business, and at a high rate of return. Unsurprisingly, this has led to an impressive earnings growth. That being so, the latest analyst forecasts show that the company will continue to see an expansion in its earnings. To know more about the latest analysts predictions for the company, check out this visualization of analyst forecasts for the company.
The New Payments ETF Is Live on NASDAQ:
Money is moving to real-time rails, and a newly listed ETF now gives investors direct exposure. Fast settlement. Institutional custody. Simple access.
Explore how this launch could reshape portfolios
Sponsored ContentNew: Manage All Your Stock Portfolios in One Place
We've created the ultimate portfolio companion for stock investors, and it's free.
• Connect an unlimited number of Portfolios and see your total in one currency
• Be alerted to new Warning Signs or Risks via email or mobile
• Track the Fair Value of your stocks
Have feedback on this article? Concerned about the content? Get in touch with us directly. Alternatively, email editorial-team (at) simplywallst.com.
This article by Simply Wall St is general in nature. We provide commentary based on historical data and analyst forecasts only using an unbiased methodology and our articles are not intended to be financial advice. It does not constitute a recommendation to buy or sell any stock, and does not take account of your objectives, or your financial situation. We aim to bring you long-term focused analysis driven by fundamental data. Note that our analysis may not factor in the latest price-sensitive company announcements or qualitative material. Simply Wall St has no position in any stocks mentioned.
Have feedback on this article? Concerned about the content? Get in touch with us directly. Alternatively, email editorial-team@simplywallst.com
About XTRA:PUM
PUMA
Engages in the development and sale of sports and sports lifestyle products in Germany, rest of Europe, the United States, North America, and internationally.
Fair value with moderate growth potential.
Similar Companies
Market Insights

Weekly Picks

THE KINGDOM OF BROWN GOODS: WHY MGPI IS BEING CRUSHED BY INVENTORY & PRIMED FOR RESURRECTION


Why Vertical Aerospace (NYSE: EVTL) is Worth Possibly Over 13x its Current Price


The Quiet Giant That Became AI’s Power Grid
Recently Updated Narratives

Butler National (Buks) outperforms.


A tech powerhouse quietly powering the world’s AI infrastructure.


Keppel DC REIT (SGX: AJBU) is a resilient gem in the data center space.
Popular Narratives

MicroVision will explode future revenue by 380.37% with a vision towards success


Crazy Undervalued 42 Baggers Silver Play (Active & Running Mine)


