- China
- /
- Auto Components
- /
- SHSE:603786
3 Chinese Stocks That Could Be Trading Below Intrinsic Value By Up To 44.2%

Reviewed by Simply Wall St

As Chinese equities have retreated recently due to weak corporate earnings and economic data, there may be opportunities for discerning investors to find undervalued stocks in this market. Identifying a good stock often involves looking for companies with strong fundamentals that are trading below their intrinsic value, especially in times of broader market weakness.
Top 10 Undervalued Stocks Based On Cash Flows In China
| Name | Current Price | Fair Value (Est) | Discount (Est) |
| KPC PharmaceuticalsInc (SHSE:600422) | CN¥13.61 | CN¥25.33 | 46.3% |
| Jiangsu Zhongtian Technology (SHSE:600522) | CN¥12.98 | CN¥24.69 | 47.4% |
| Beijing SDL TechnologyLtd (SZSE:002658) | CN¥5.36 | CN¥10.65 | 49.7% |
| Shandong Bailong Chuangyuan Bio-Tech (SHSE:605016) | CN¥16.76 | CN¥33.11 | 49.4% |
| Beijing InHand Networks Technology (SHSE:688080) | CN¥24.29 | CN¥45.38 | 46.5% |
| Xiamen Jihong Technology (SZSE:002803) | CN¥10.04 | CN¥18.53 | 45.8% |
| NBTM New Materials Group (SHSE:600114) | CN¥14.93 | CN¥27.56 | 45.8% |
| Jiangsu Hongdou IndustrialLTD (SHSE:600400) | CN¥2.15 | CN¥4.15 | 48.1% |
| SKSHU PaintLtd (SHSE:603737) | CN¥27.88 | CN¥52.19 | 46.6% |
| Chengdu Olymvax Biopharmaceuticals (SHSE:688319) | CN¥8.43 | CN¥16.84 | 49.9% |
We're going to check out a few of the best picks from our screener tool.
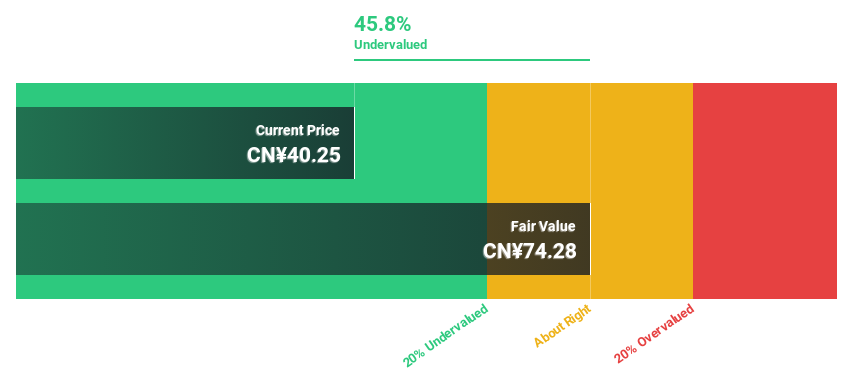
Ecovacs Robotics (SHSE:603486)
Overview: Ecovacs Robotics Co., Ltd. engages in the research, development, design, manufacture, and sale of robotic products in China and has a market cap of CN¥23.81 billion.
Operations: Ecovacs Robotics generates its revenue from the research, development, design, manufacture, and sale of robotic products in China.
Estimated Discount To Fair Value: 44.2%
Ecovacs Robotics, trading at 44.2% below its estimated fair value of CNY 74.96, reported half-year earnings with net income rising to CNY 608.98 million from CNY 584.08 million a year ago despite a slight revenue decline to CNY 6,976.05 million. Earnings are forecasted to grow significantly at 34.28% per year, outpacing the market average of 23%. However, profit margins have decreased from last year's figures due to large one-off items impacting financial results.
- The analysis detailed in our Ecovacs Robotics growth report hints at robust future financial performance.
- Take a closer look at Ecovacs Robotics' balance sheet health here in our report.
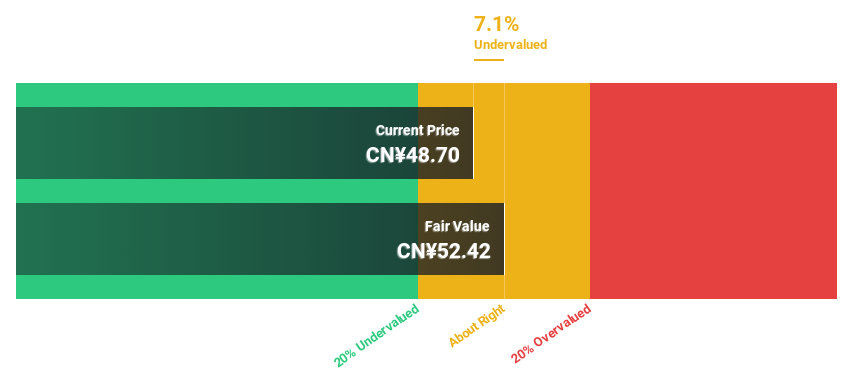
KEBODA TECHNOLOGY (SHSE:603786)
Overview: KEBODA TECHNOLOGY Co., Ltd. manufactures and sells automotive electronics and related products for the automotive industry in China, with a market cap of CN¥18.98 billion.
Operations: KEBODA TECHNOLOGY Co., Ltd. generates revenue primarily through the production and distribution of automotive electronics and related products within China's automotive sector.
Estimated Discount To Fair Value: 10.4%
KEBODA TECHNOLOGY, trading at 10.4% below its fair value of CN¥52.77, reported half-year sales of CN¥2.74 billion, up from CN¥1.96 billion a year ago, with net income rising to CN¥371.57 million from CN¥275.54 million. Earnings are forecasted to grow significantly at 26.8% per year, outpacing the Chinese market average of 23%, while revenue is expected to increase by 22.1% annually over the next three years.
- According our earnings growth report, there's an indication that KEBODA TECHNOLOGY might be ready to expand.
- Dive into the specifics of KEBODA TECHNOLOGY here with our thorough financial health report.
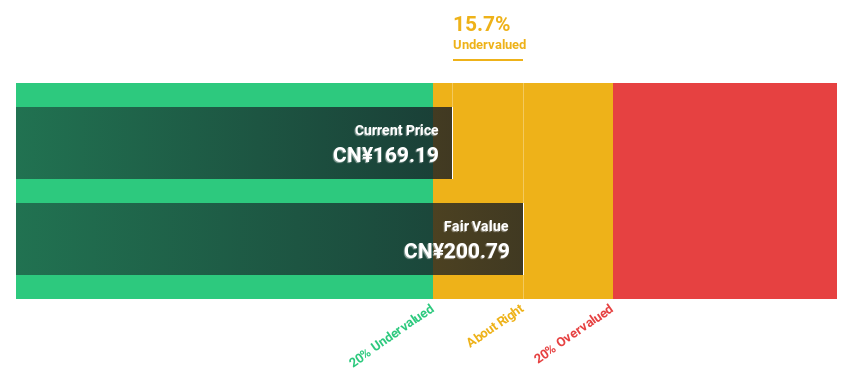
Shanghai BOCHU Electronic Technology (SHSE:688188)
Overview: Shanghai BOCHU Electronic Technology Corporation Limited (SHSE:688188) operates in the electronic technology sector with a market cap of CN¥34.03 billion.
Operations: Shanghai BOCHU Electronic Technology Corporation Limited generates its revenue from various segments within the electronic technology sector.
Estimated Discount To Fair Value: 17.9%
Shanghai BOCHU Electronic Technology, trading at CN¥165.65, is 17.9% below its estimated fair value of CN¥201.7. Earnings grew by 44.5% last year and are forecast to rise by 28.58% annually, outpacing the Chinese market's 23%. Revenue for the first half of 2024 was CN¥883.59 million, up from CN¥661.1 million a year ago, with net income increasing to CN¥491.18 million from CN¥362.03 million over the same period.
- Our expertly prepared growth report on Shanghai BOCHU Electronic Technology implies its future financial outlook may be stronger than recent results.
- Get an in-depth perspective on Shanghai BOCHU Electronic Technology's balance sheet by reading our health report here.
Taking Advantage
- Click here to access our complete index of 108 Undervalued Chinese Stocks Based On Cash Flows.
- Invested in any of these stocks? Simplify your portfolio management with Simply Wall St and stay ahead with our alerts for any critical updates on your stocks.
- Simply Wall St is your key to unlocking global market trends, a free user-friendly app for forward-thinking investors.
Ready To Venture Into Other Investment Styles?
- Explore high-performing small cap companies that haven't yet garnered significant analyst attention.
- Diversify your portfolio with solid dividend payers offering reliable income streams to weather potential market turbulence.
- Fuel your portfolio with companies showing strong growth potential, backed by optimistic outlooks both from analysts and management.
This article by Simply Wall St is general in nature. We provide commentary based on historical data and analyst forecasts only using an unbiased methodology and our articles are not intended to be financial advice. It does not constitute a recommendation to buy or sell any stock, and does not take account of your objectives, or your financial situation. We aim to bring you long-term focused analysis driven by fundamental data. Note that our analysis may not factor in the latest price-sensitive company announcements or qualitative material. Simply Wall St has no position in any stocks mentioned.
Valuation is complex, but we're here to simplify it.
Discover if KEBODA TECHNOLOGY might be undervalued or overvalued with our detailed analysis, featuring fair value estimates, potential risks, dividends, insider trades, and its financial condition.
Access Free AnalysisHave feedback on this article? Concerned about the content? Get in touch with us directly. Alternatively, email editorial-team@simplywallst.com
About SHSE:603786
KEBODA TECHNOLOGY
Engages in the manufacture and sale of automotive electronics and related products for automotive industry in China.
Flawless balance sheet with high growth potential.
