
Advertisement
Dollarama Inc. (TSE:DOL) Shares Could Be 25% Above Their Intrinsic Value Estimate

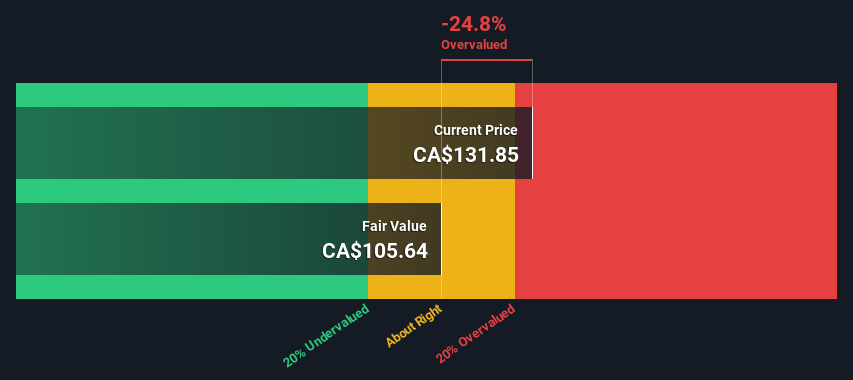
Key Insights
- Using the 2 Stage Free Cash Flow to Equity, Dollarama fair value estimate is CA$106
- Dollarama's CA$132 share price signals that it might be 25% overvalued
- Our fair value estimate is 19% lower than Dollarama's analyst price target of CA$131
Today we will run through one way of estimating the intrinsic value of Dollarama Inc. (TSE:DOL) by projecting its future cash flows and then discounting them to today's value. We will use the Discounted Cash Flow (DCF) model on this occasion. It may sound complicated, but actually it is quite simple!
We would caution that there are many ways of valuing a company and, like the DCF, each technique has advantages and disadvantages in certain scenarios. If you want to learn more about discounted cash flow, the rationale behind this calculation can be read in detail in the Simply Wall St analysis model.
View our latest analysis for Dollarama
Is Dollarama Fairly Valued?
We use what is known as a 2-stage model, which simply means we have two different periods of growth rates for the company's cash flows. Generally the first stage is higher growth, and the second stage is a lower growth phase. To begin with, we have to get estimates of the next ten years of cash flows. Where possible we use analyst estimates, but when these aren't available we extrapolate the previous free cash flow (FCF) from the last estimate or reported value. We assume companies with shrinking free cash flow will slow their rate of shrinkage, and that companies with growing free cash flow will see their growth rate slow, over this period. We do this to reflect that growth tends to slow more in the early years than it does in later years.
A DCF is all about the idea that a dollar in the future is less valuable than a dollar today, so we need to discount the sum of these future cash flows to arrive at a present value estimate:
10-year free cash flow (FCF) estimate
| 2025 | 2026 | 2027 | 2028 | 2029 | 2030 | 2031 | 2032 | 2033 | 2034 | |
| Levered FCF (CA$, Millions) | CA$1.11b | CA$1.20b | CA$1.26b | CA$1.32b | CA$1.37b | CA$1.42b | CA$1.46b | CA$1.50b | CA$1.54b | CA$1.58b |
| Growth Rate Estimate Source | Analyst x5 | Analyst x5 | Est @ 5.59% | Est @ 4.57% | Est @ 3.85% | Est @ 3.35% | Est @ 3.00% | Est @ 2.75% | Est @ 2.58% | Est @ 2.46% |
| Present Value (CA$, Millions) Discounted @ 6.5% | CA$1.0k | CA$1.1k | CA$1.0k | CA$1.0k | CA$1.0k | CA$973 | CA$942 | CA$909 | CA$876 | CA$843 |
("Est" = FCF growth rate estimated by Simply Wall St)
Present Value of 10-year Cash Flow (PVCF) = CA$9.7b
After calculating the present value of future cash flows in the initial 10-year period, we need to calculate the Terminal Value, which accounts for all future cash flows beyond the first stage. For a number of reasons a very conservative growth rate is used that cannot exceed that of a country's GDP growth. In this case we have used the 5-year average of the 10-year government bond yield (2.2%) to estimate future growth. In the same way as with the 10-year 'growth' period, we discount future cash flows to today's value, using a cost of equity of 6.5%.
Terminal Value (TV)= FCF2034 × (1 + g) ÷ (r – g) = CA$1.6b× (1 + 2.2%) ÷ (6.5%– 2.2%) = CA$38b
Present Value of Terminal Value (PVTV)= TV / (1 + r)10= CA$38b÷ ( 1 + 6.5%)10= CA$20b
The total value, or equity value, is then the sum of the present value of the future cash flows, which in this case is CA$30b. In the final step we divide the equity value by the number of shares outstanding. Compared to the current share price of CA$132, the company appears slightly overvalued at the time of writing. Valuations are imprecise instruments though, rather like a telescope - move a few degrees and end up in a different galaxy. Do keep this in mind.
Important Assumptions
The calculation above is very dependent on two assumptions. The first is the discount rate and the other is the cash flows. If you don't agree with these result, have a go at the calculation yourself and play with the assumptions. The DCF also does not consider the possible cyclicality of an industry, or a company's future capital requirements, so it does not give a full picture of a company's potential performance. Given that we are looking at Dollarama as potential shareholders, the cost of equity is used as the discount rate, rather than the cost of capital (or weighted average cost of capital, WACC) which accounts for debt. In this calculation we've used 6.5%, which is based on a levered beta of 1.042. Beta is a measure of a stock's volatility, compared to the market as a whole. We get our beta from the industry average beta of globally comparable companies, with an imposed limit between 0.8 and 2.0, which is a reasonable range for a stable business.
SWOT Analysis for Dollarama
Strength
- Earnings growth over the past year exceeded its 5-year average.
- Debt is well covered by earnings and cashflows.
Weakness
- Earnings growth over the past year underperformed the Multiline Retail industry.
- Dividend is low compared to the top 25% of dividend payers in the Multiline Retail market.
- Expensive based on P/E ratio and estimated fair value.
Opportunity
- Annual earnings are forecast to grow for the next 3 years.
Threat
- Annual earnings are forecast to grow slower than the Canadian market.
Moving On:
Whilst important, the DCF calculation ideally won't be the sole piece of analysis you scrutinize for a company. The DCF model is not a perfect stock valuation tool. Rather it should be seen as a guide to "what assumptions need to be true for this stock to be under/overvalued?" For example, changes in the company's cost of equity or the risk free rate can significantly impact the valuation. What is the reason for the share price exceeding the intrinsic value? For Dollarama, we've compiled three essential items you should look at:
- Risks: For example, we've discovered 2 warning signs for Dollarama that you should be aware of before investing here.
- Future Earnings: How does DOL's growth rate compare to its peers and the wider market? Dig deeper into the analyst consensus number for the upcoming years by interacting with our free analyst growth expectation chart.
- Other Solid Businesses: Low debt, high returns on equity and good past performance are fundamental to a strong business. Why not explore our interactive list of stocks with solid business fundamentals to see if there are other companies you may not have considered!
PS. Simply Wall St updates its DCF calculation for every Canadian stock every day, so if you want to find the intrinsic value of any other stock just search here.
New: Manage All Your Stock Portfolios in One Place
We've created the ultimate portfolio companion for stock investors, and it's free.
• Connect an unlimited number of Portfolios and see your total in one currency
• Be alerted to new Warning Signs or Risks via email or mobile
• Track the Fair Value of your stocks
Have feedback on this article? Concerned about the content? Get in touch with us directly. Alternatively, email editorial-team (at) simplywallst.com.
This article by Simply Wall St is general in nature. We provide commentary based on historical data and analyst forecasts only using an unbiased methodology and our articles are not intended to be financial advice. It does not constitute a recommendation to buy or sell any stock, and does not take account of your objectives, or your financial situation. We aim to bring you long-term focused analysis driven by fundamental data. Note that our analysis may not factor in the latest price-sensitive company announcements or qualitative material. Simply Wall St has no position in any stocks mentioned.
About TSX:DOL
Dollarama
Operates a chain of stores and provides related logistical and administrative support activities.
Adequate balance sheet with moderate growth potential.
Similar Companies
Market Insights

Advertisement
Community Narratives
The Most Undervalued of the Magnificent 7
Fair Value US$237.43|36.3% undervalued
IN
Community Contributor
PVA TePla's New Strategy Aims for 22% Revenue Growth in Semiconductor Recovery
Fair Value €19.19|20.8% undervalued
MI
Community Contributor