- Canada
- /
- Food and Staples Retail
- /
- TSX:GCL
Shareholders May Be More Conservative With Colabor Group Inc.'s (TSE:GCL) CEO Compensation For Now

Key Insights
- Colabor Group to hold its Annual General Meeting on 16th of May
- Salary of CA$640.8k is part of CEO Louis Frenette's total remuneration
- The overall pay is 86% above the industry average
- Colabor Group's EPS declined by 1.8% over the past three years while total shareholder return over the past three years was 19%
Despite Colabor Group Inc.'s (TSE:GCL) share price growing positively in the past few years, the per-share earnings growth has not grown to investors' expectations, suggesting that there could be other factors at play driving the share price. The upcoming AGM on 16th of May may be an opportunity for shareholders to bring up any concerns they may have for the board’s attention. One way that shareholders can influence managerial decisions is through voting on CEO and executive remuneration packages, which studies show could impact company performance. In our analysis below, we show why shareholders may consider holding off a raise for the CEO's compensation until company performance improves.
See our latest analysis for Colabor Group
Comparing Colabor Group Inc.'s CEO Compensation With The Industry
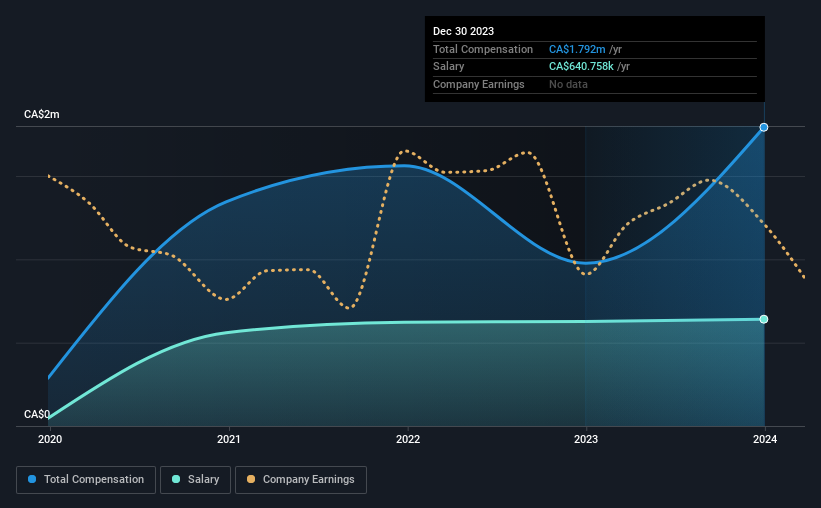
At the time of writing, our data shows that Colabor Group Inc. has a market capitalization of CA$113m, and reported total annual CEO compensation of CA$1.8m for the year to December 2023. Notably, that's an increase of 84% over the year before. We think total compensation is more important but our data shows that the CEO salary is lower, at CA$641k.
In comparison with other companies in the Canadian Consumer Retailing industry with market capitalizations under CA$274m, the reported median total CEO compensation was CA$963k. Hence, we can conclude that Louis Frenette is remunerated higher than the industry median. Moreover, Louis Frenette also holds CA$1.2m worth of Colabor Group stock directly under their own name.
| Component | 2023 | 2022 | Proportion (2023) |
| Salary | CA$641k | CA$627k | 36% |
| Other | CA$1.2m | CA$349k | 64% |
| Total Compensation | CA$1.8m | CA$976k | 100% |
On an industry level, around 19% of total compensation represents salary and 81% is other remuneration. It's interesting to note that Colabor Group pays out a greater portion of remuneration through salary, compared to the industry. It's important to note that a slant towards non-salary compensation suggests that total pay is tied to the company's performance.
A Look at Colabor Group Inc.'s Growth Numbers
Colabor Group Inc. has reduced its earnings per share by 1.8% a year over the last three years. It achieved revenue growth of 7.6% over the last year.
The lack of EPS growth is certainly uninspiring. And the modest revenue growth over 12 months isn't much comfort against the reduced EPS. These factors suggest that the business performance wouldn't really justify a high pay packet for the CEO. Historical performance can sometimes be a good indicator on what's coming up next but if you want to peer into the company's future you might be interested in this free visualization of analyst forecasts.
Has Colabor Group Inc. Been A Good Investment?
With a total shareholder return of 19% over three years, Colabor Group Inc. shareholders would, in general, be reasonably content. But they would probably prefer not to see CEO compensation far in excess of the median.
In Summary...
Despite the positive returns on shareholders' investments, the fact that earnings have failed to grow makes us skeptical about whether these returns will continue. Shareholders should make the most of the coming opportunity to question the board on key concerns they may have and revisit their investment thesis with regards to the company.
We can learn a lot about a company by studying its CEO compensation trends, along with looking at other aspects of the business. In our study, we found 3 warning signs for Colabor Group you should be aware of, and 1 of them is significant.
Switching gears from Colabor Group, if you're hunting for a pristine balance sheet and premium returns, this free list of high return, low debt companies is a great place to look.
The New Payments ETF Is Live on NASDAQ:
Money is moving to real-time rails, and a newly listed ETF now gives investors direct exposure. Fast settlement. Institutional custody. Simple access.
Explore how this launch could reshape portfolios
Sponsored ContentNew: AI Stock Screener & Alerts
Our new AI Stock Screener scans the market every day to uncover opportunities.
• Dividend Powerhouses (3%+ Yield)
• Undervalued Small Caps with Insider Buying
• High growth Tech and AI Companies
Or build your own from over 50 metrics.
Have feedback on this article? Concerned about the content? Get in touch with us directly. Alternatively, email editorial-team (at) simplywallst.com.
This article by Simply Wall St is general in nature. We provide commentary based on historical data and analyst forecasts only using an unbiased methodology and our articles are not intended to be financial advice. It does not constitute a recommendation to buy or sell any stock, and does not take account of your objectives, or your financial situation. We aim to bring you long-term focused analysis driven by fundamental data. Note that our analysis may not factor in the latest price-sensitive company announcements or qualitative material. Simply Wall St has no position in any stocks mentioned.
About TSX:GCL
Colabor Group
Colabor Group Inc., together with its subsidiaries, markets, distributes, and wholesales food and food-related products in Canada.
Undervalued with mediocre balance sheet.
Similar Companies
Market Insights

Weekly Picks

THE KINGDOM OF BROWN GOODS: WHY MGPI IS BEING CRUSHED BY INVENTORY & PRIMED FOR RESURRECTION


Why Vertical Aerospace (NYSE: EVTL) is Worth Possibly Over 13x its Current Price


The Quiet Giant That Became AI’s Power Grid
Recently Updated Narratives


Unicycive Therapeutics (Nasdaq: UNCY) – Preparing for a Second Shot at Bringing a New Kidney Treatment to Market (TEST)

Rocket Lab USA Will Ignite a 30% Revenue Growth Journey


Dollar general to grow
Popular Narratives


MicroVision will explode future revenue by 380.37% with a vision towards success


NVDA: Expanding AI Demand Will Drive Major Data Center Investments Through 2026


