Declining Stock and Solid Fundamentals: Is The Market Wrong About Spin Master Corp. (TSE:TOY)?

With its stock down 2.3% over the past week, it is easy to disregard Spin Master (TSE:TOY). But if you pay close attention, you might gather that its strong financials could mean that the stock could potentially see an increase in value in the long-term, given how markets usually reward companies with good financial health. Specifically, we decided to study Spin Master's ROE in this article.
Return on Equity or ROE is a test of how effectively a company is growing its value and managing investors’ money. In short, ROE shows the profit each dollar generates with respect to its shareholder investments.
Check out our latest analysis for Spin Master
How To Calculate Return On Equity?
The formula for ROE is:
Return on Equity = Net Profit (from continuing operations) ÷ Shareholders' Equity
So, based on the above formula, the ROE for Spin Master is:
12% = US$168m ÷ US$1.4b (Based on the trailing twelve months to September 2023).
The 'return' is the profit over the last twelve months. So, this means that for every CA$1 of its shareholder's investments, the company generates a profit of CA$0.12.
What Has ROE Got To Do With Earnings Growth?
We have already established that ROE serves as an efficient profit-generating gauge for a company's future earnings. We now need to evaluate how much profit the company reinvests or "retains" for future growth which then gives us an idea about the growth potential of the company. Assuming all else is equal, companies that have both a higher return on equity and higher profit retention are usually the ones that have a higher growth rate when compared to companies that don't have the same features.
Spin Master's Earnings Growth And 12% ROE
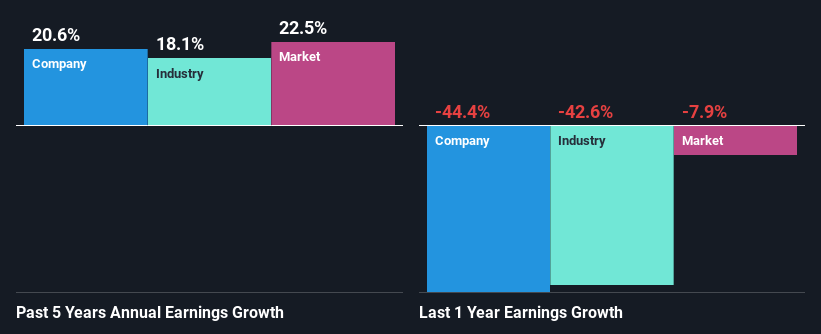
To start with, Spin Master's ROE looks acceptable. Further, the company's ROE is similar to the industry average of 13%. This probably goes some way in explaining Spin Master's significant 21% net income growth over the past five years amongst other factors. However, there could also be other drivers behind this growth. Such as - high earnings retention or an efficient management in place.
Next, on comparing Spin Master's net income growth with the industry, we found that the company's reported growth is similar to the industry average growth rate of 18% over the last few years.
Earnings growth is an important metric to consider when valuing a stock. It’s important for an investor to know whether the market has priced in the company's expected earnings growth (or decline). This then helps them determine if the stock is placed for a bright or bleak future. If you're wondering about Spin Master's's valuation, check out this gauge of its price-to-earnings ratio, as compared to its industry.
Is Spin Master Making Efficient Use Of Its Profits?
Spin Master has a really low three-year median payout ratio of 6.4%, meaning that it has the remaining 94% left over to reinvest into its business. So it looks like Spin Master is reinvesting profits heavily to grow its business, which shows in its earnings growth.
While Spin Master has been growing its earnings, it only recently started to pay dividends which likely means that the company decided to impress new and existing shareholders with a dividend. Our latest analyst data shows that the future payout ratio of the company is expected to rise to 20% over the next three years. However, the company's ROE is not expected to change by much despite the higher expected payout ratio.
Conclusion
On the whole, we feel that Spin Master's performance has been quite good. In particular, it's great to see that the company is investing heavily into its business and along with a high rate of return, that has resulted in a sizeable growth in its earnings. With that said, the latest industry analyst forecasts reveal that the company's earnings growth is expected to slow down. Are these analysts expectations based on the broad expectations for the industry, or on the company's fundamentals? Click here to be taken to our analyst's forecasts page for the company.
Mobile Infrastructure for Defense and Disaster
The next wave in robotics isn't humanoid. Its fully autonomous towers delivering 5G, ISR, and radar in under 30 minutes, anywhere.
Get the investor briefing before the next round of contracts
Sponsored On Behalf of CiTechNew: Manage All Your Stock Portfolios in One Place
We've created the ultimate portfolio companion for stock investors, and it's free.
• Connect an unlimited number of Portfolios and see your total in one currency
• Be alerted to new Warning Signs or Risks via email or mobile
• Track the Fair Value of your stocks
Have feedback on this article? Concerned about the content? Get in touch with us directly. Alternatively, email editorial-team (at) simplywallst.com.
This article by Simply Wall St is general in nature. We provide commentary based on historical data and analyst forecasts only using an unbiased methodology and our articles are not intended to be financial advice. It does not constitute a recommendation to buy or sell any stock, and does not take account of your objectives, or your financial situation. We aim to bring you long-term focused analysis driven by fundamental data. Note that our analysis may not factor in the latest price-sensitive company announcements or qualitative material. Simply Wall St has no position in any stocks mentioned.
About TSX:TOY
Spin Master
A children’s entertainment company, engages in the creation, design, manufacture, licensing, and marketing of various toys, entertainment products, and digital games in North America, Europe, and internationally.
Excellent balance sheet and good value.
Similar Companies
Market Insights

Weekly Picks

THE KINGDOM OF BROWN GOODS: WHY MGPI IS BEING CRUSHED BY INVENTORY & PRIMED FOR RESURRECTION


Why Vertical Aerospace (NYSE: EVTL) is Worth Possibly Over 13x its Current Price


The Quiet Giant That Became AI’s Power Grid
Recently Updated Narratives


Fiverr International will transform the freelance industry with AI-powered growth

Jackson Financial Stock: When Insurance Math Meets a Shifting Claims Landscape

Stride Stock: Online Education Finds Its Second Act
Popular Narratives


MicroVision will explode future revenue by 380.37% with a vision towards success


Crazy Undervalued 42 Baggers Silver Play (Active & Running Mine)


NVDA: Expanding AI Demand Will Drive Major Data Center Investments Through 2026
Trending Discussion
<html><head></head><body><div dir="auto">This is true here, but always true in the case of Alpha leaders. Often is takes a turn or two to get it right, like Gates to Nardella,  or Anton to Pinchar. This is when succession planning has failed or never happened. </div><div><br></div> </body></html>