
Advertisement
- Australia
- /
- Metals and Mining
- /
- ASX:VAU
Even though Red 5 (ASX:RED) has lost AU$1.2b market cap in last 7 days, shareholders are still up 155% over 5 years

The most you can lose on any stock (assuming you don't use leverage) is 100% of your money. But when you pick a company that is really flourishing, you can make more than 100%. For instance, the price of Red 5 Limited (ASX:RED) stock is up an impressive 148% over the last five years. Also pleasing for shareholders was the 12% gain in the last three months.
Although Red 5 has shed AU$1.2b from its market cap this week, let's take a look at its longer term fundamental trends and see if they've driven returns.
View our latest analysis for Red 5
There is no denying that markets are sometimes efficient, but prices do not always reflect underlying business performance. One way to examine how market sentiment has changed over time is to look at the interaction between a company's share price and its earnings per share (EPS).
During the five years of share price growth, Red 5 moved from a loss to profitability. Sometimes, the start of profitability is a major inflection point that can signal fast earnings growth to come, which in turn justifies very strong share price gains. Since the company was unprofitable five years ago, but not three years ago, it's worth taking a look at the returns in the last three years, too. Indeed, the Red 5 share price has gained 122% in three years. Meanwhile, EPS is up 61% per year. This EPS growth is higher than the 30% average annual increase in the share price over the same three years. So you might conclude the market is a little more cautious about the stock, these days. Having said that, the market is still optimistic, given the P/E ratio of 57.19.
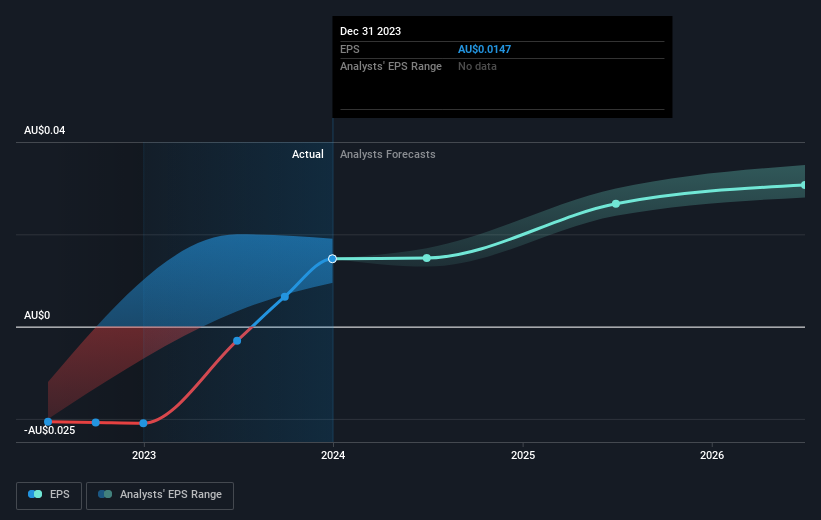
The company's earnings per share (over time) is depicted in the image below (click to see the exact numbers).
We know that Red 5 has improved its bottom line over the last three years, but what does the future have in store? You can see how its balance sheet has strengthened (or weakened) over time in this free interactive graphic.
What About The Total Shareholder Return (TSR)?
We'd be remiss not to mention the difference between Red 5's total shareholder return (TSR) and its share price return. The TSR is a return calculation that accounts for the value of cash dividends (assuming that any dividend received was reinvested) and the calculated value of any discounted capital raisings and spin-offs. We note that Red 5's TSR, at 155% is higher than its share price return of 148%. When you consider it hasn't been paying a dividend, this data suggests shareholders have benefitted from a spin-off, or had the opportunity to acquire attractively priced shares in a discounted capital raising.
A Different Perspective
We're pleased to report that Red 5 shareholders have received a total shareholder return of 134% over one year. Since the one-year TSR is better than the five-year TSR (the latter coming in at 21% per year), it would seem that the stock's performance has improved in recent times. In the best case scenario, this may hint at some real business momentum, implying that now could be a great time to delve deeper. I find it very interesting to look at share price over the long term as a proxy for business performance. But to truly gain insight, we need to consider other information, too. Even so, be aware that Red 5 is showing 1 warning sign in our investment analysis , you should know about...
If you would prefer to check out another company -- one with potentially superior financials -- then do not miss this free list of companies that have proven they can grow earnings.
Please note, the market returns quoted in this article reflect the market weighted average returns of stocks that currently trade on Australian exchanges.
New: Manage All Your Stock Portfolios in One Place
We've created the ultimate portfolio companion for stock investors, and it's free.
• Connect an unlimited number of Portfolios and see your total in one currency
• Be alerted to new Warning Signs or Risks via email or mobile
• Track the Fair Value of your stocks
Have feedback on this article? Concerned about the content? Get in touch with us directly. Alternatively, email editorial-team (at) simplywallst.com.
This article by Simply Wall St is general in nature. We provide commentary based on historical data and analyst forecasts only using an unbiased methodology and our articles are not intended to be financial advice. It does not constitute a recommendation to buy or sell any stock, and does not take account of your objectives, or your financial situation. We aim to bring you long-term focused analysis driven by fundamental data. Note that our analysis may not factor in the latest price-sensitive company announcements or qualitative material. Simply Wall St has no position in any stocks mentioned.
Have feedback on this article? Concerned about the content? Get in touch with us directly. Alternatively, email editorial-team@simplywallst.com
About ASX:VAU
Vault Minerals
Engages in the exploration, production, and mining of gold and gold/copper concentrates in Canada and Australia.
Flawless balance sheet with reasonable growth potential.
Similar Companies
Market Insights

Advertisement
Community Narratives
RIO is poised to weather a depressed iron ore environment, but commodity diversification comes with lower margins
Fair Value AU$110.51|1.0% overvalued
DU
Community Contributor
The demand for personalized medicine will keep Thermo Fisher Scientific thriving
Fair Value US$540.27|19.5% undervalued
UN
Community Contributor
Silver Play by A Family with 10x Potential
Fair Value UK£24.00|87.3% undervalued
RO
Community Contributor