
Advertisement
Investing in Dyno Nobel (ASX:DNL) five years ago would have delivered you a 92% gain
The simplest way to invest in stocks is to buy exchange traded funds. But in our experience, buying the right stocks can give your wealth a significant boost. For example, the Dyno Nobel Limited (ASX:DNL) share price is up 43% in the last five years, slightly above the market return. Zooming in, the stock is actually down 5.2% in the last year.
Let's take a look at the underlying fundamentals over the longer term, and see if they've been consistent with shareholders returns.
To paraphrase Benjamin Graham: Over the short term the market is a voting machine, but over the long term it's a weighing machine. One imperfect but simple way to consider how the market perception of a company has shifted is to compare the change in the earnings per share (EPS) with the share price movement.
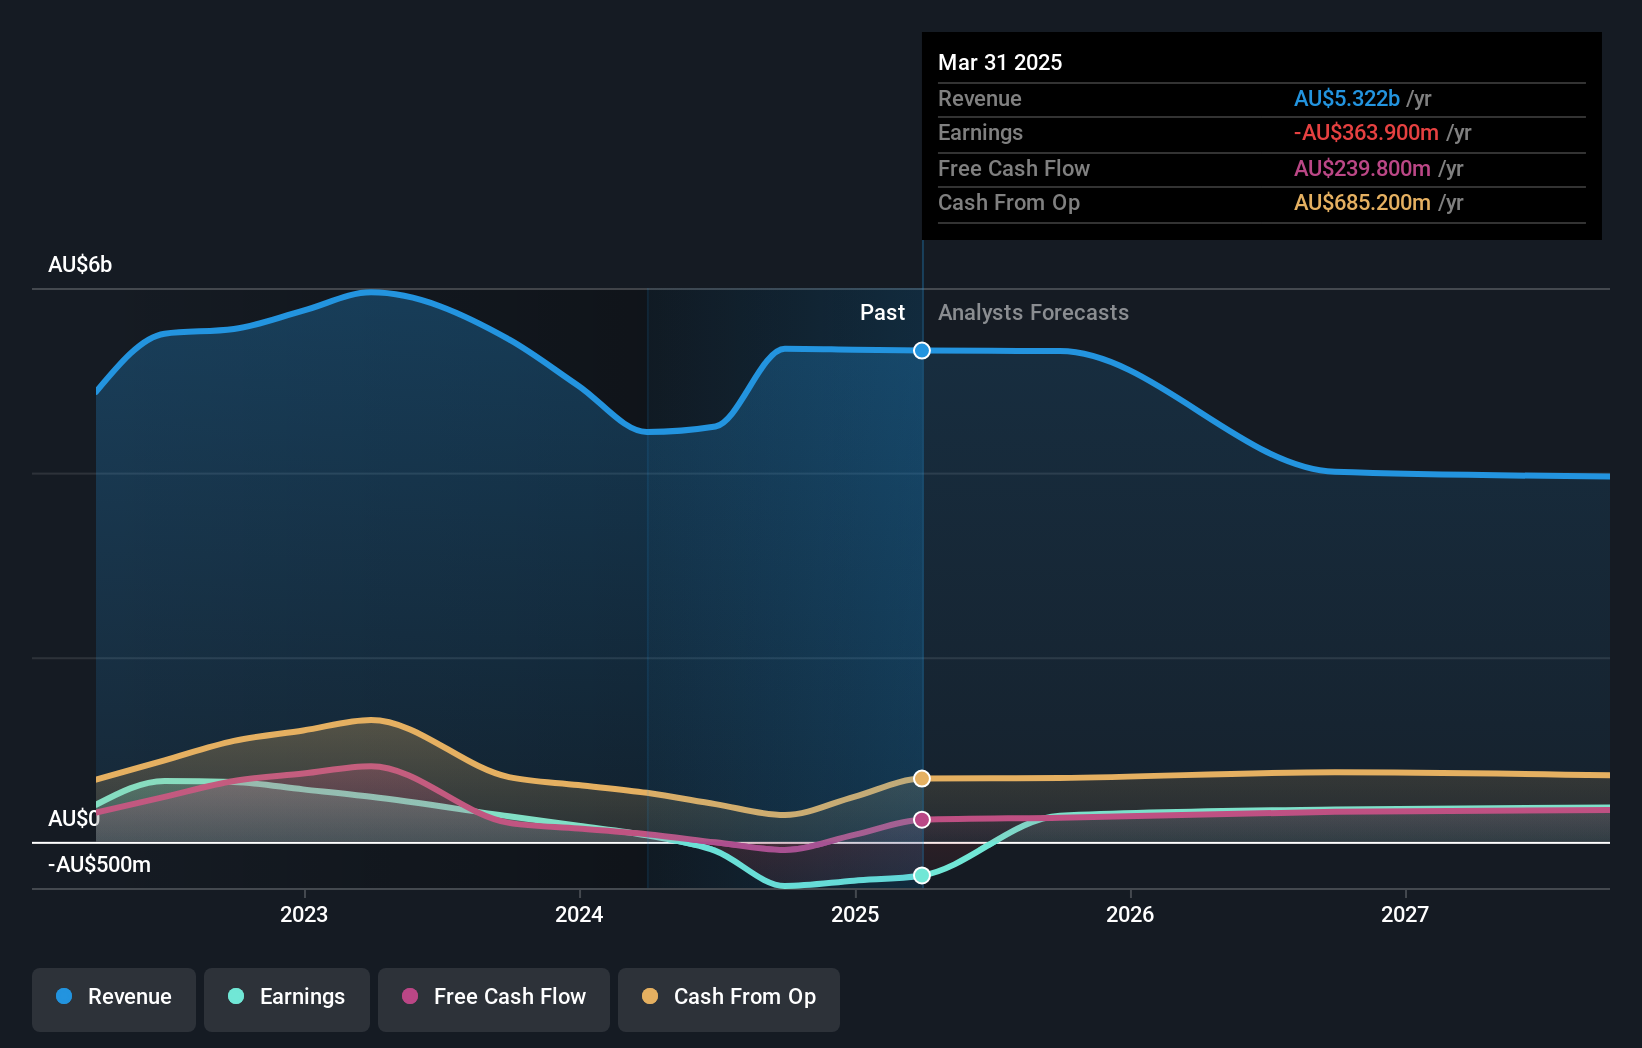
During five years of share price growth, Dyno Nobel actually saw its EPS drop 31% per year. This was, in part, due to extraordinary items impacting earning in the last twelve months.
Essentially, it doesn't seem likely that investors are focused on EPS. Because earnings per share don't seem to match up with the share price, we'll take a look at other metrics instead.
In contrast revenue growth of 5.9% per year is probably viewed as evidence that Dyno Nobel is growing, a real positive. It's quite possible that management are prioritizing revenue growth over EPS growth at the moment.
The image below shows how earnings and revenue have tracked over time (if you click on the image you can see greater detail).
We consider it positive that insiders have made significant purchases in the last year. Even so, future earnings will be far more important to whether current shareholders make money. So we recommend checking out this free report showing consensus forecasts
What About Dividends?
When looking at investment returns, it is important to consider the difference between total shareholder return (TSR) and share price return. Whereas the share price return only reflects the change in the share price, the TSR includes the value of dividends (assuming they were reinvested) and the benefit of any discounted capital raising or spin-off. It's fair to say that the TSR gives a more complete picture for stocks that pay a dividend. As it happens, Dyno Nobel's TSR for the last 5 years was 92%, which exceeds the share price return mentioned earlier. This is largely a result of its dividend payments!
A Different Perspective
Investors in Dyno Nobel had a tough year, with a total loss of 2.5% (including dividends), against a market gain of about 13%. However, keep in mind that even the best stocks will sometimes underperform the market over a twelve month period. Longer term investors wouldn't be so upset, since they would have made 14%, each year, over five years. If the fundamental data continues to indicate long term sustainable growth, the current sell-off could be an opportunity worth considering. It's always interesting to track share price performance over the longer term. But to understand Dyno Nobel better, we need to consider many other factors. For instance, we've identified 1 warning sign for Dyno Nobel that you should be aware of.
There are plenty of other companies that have insiders buying up shares. You probably do not want to miss this free list of undervalued small cap companies that insiders are buying.
Please note, the market returns quoted in this article reflect the market weighted average returns of stocks that currently trade on Australian exchanges.
New: Manage All Your Stock Portfolios in One Place
We've created the ultimate portfolio companion for stock investors, and it's free.
• Connect an unlimited number of Portfolios and see your total in one currency
• Be alerted to new Warning Signs or Risks via email or mobile
• Track the Fair Value of your stocks
Have feedback on this article? Concerned about the content? Get in touch with us directly. Alternatively, email editorial-team (at) simplywallst.com.
This article by Simply Wall St is general in nature. We provide commentary based on historical data and analyst forecasts only using an unbiased methodology and our articles are not intended to be financial advice. It does not constitute a recommendation to buy or sell any stock, and does not take account of your objectives, or your financial situation. We aim to bring you long-term focused analysis driven by fundamental data. Note that our analysis may not factor in the latest price-sensitive company announcements or qualitative material. Simply Wall St has no position in any stocks mentioned.
About ASX:DNL
Dyno Nobel
Manufactures and distributes commercial explosives in in the United States, Australia, and Mexico.
Flawless balance sheet and fair value.
Similar Companies
Market Insights

Advertisement
Community Narratives
A formidable player in AI and enterprise computing.
Fair Value US$210.00|12.2% overvalued
CO
Community Contributor
IREN's Bold Moves in Sustainable Bitcoin Mining & AI Data Centers
Fair Value US$72.52|17.1% undervalued
BL
Community Contributor
Cooling the Champions: The Aussie Tech Behind F1's Victories
Fair Value AU$12.40|38.7% undervalued
TR
Community Contributor