AUB Group Limited (ASX:AUB) Stock's Been Sliding But Fundamentals Look Decent: Will The Market Correct The Share Price In The Future?


With its stock down 6.5% over the past three months, it is easy to disregard AUB Group (ASX:AUB). However, the company's fundamentals look pretty decent, and long-term financials are usually aligned with future market price movements. Particularly, we will be paying attention to AUB Group's ROE today.
Return on equity or ROE is a key measure used to assess how efficiently a company's management is utilizing the company's capital. Put another way, it reveals the company's success at turning shareholder investments into profits.
View our latest analysis for AUB Group
How Is ROE Calculated?
ROE can be calculated by using the formula:
Return on Equity = Net Profit (from continuing operations) ÷ Shareholders' Equity
So, based on the above formula, the ROE for AUB Group is:
9.9% = AU$147m ÷ AU$1.5b (Based on the trailing twelve months to December 2023).
The 'return' is the amount earned after tax over the last twelve months. So, this means that for every A$1 of its shareholder's investments, the company generates a profit of A$0.10.
Why Is ROE Important For Earnings Growth?
We have already established that ROE serves as an efficient profit-generating gauge for a company's future earnings. Depending on how much of these profits the company reinvests or "retains", and how effectively it does so, we are then able to assess a company’s earnings growth potential. Assuming all else is equal, companies that have both a higher return on equity and higher profit retention are usually the ones that have a higher growth rate when compared to companies that don't have the same features.
A Side By Side comparison of AUB Group's Earnings Growth And 9.9% ROE
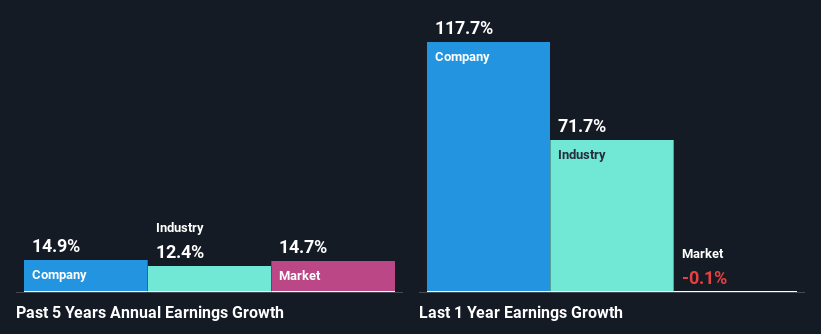
At first glance, AUB Group's ROE doesn't look very promising. We then compared the company's ROE to the broader industry and were disappointed to see that the ROE is lower than the industry average of 13%. However, the moderate 15% net income growth seen by AUB Group over the past five years is definitely a positive. So, there might be other aspects that are positively influencing the company's earnings growth. For example, it is possible that the company's management has made some good strategic decisions, or that the company has a low payout ratio.
Next, on comparing with the industry net income growth, we found that AUB Group's growth is quite high when compared to the industry average growth of 12% in the same period, which is great to see.
Earnings growth is a huge factor in stock valuation. The investor should try to establish if the expected growth or decline in earnings, whichever the case may be, is priced in. By doing so, they will have an idea if the stock is headed into clear blue waters or if swampy waters await. Is AUB fairly valued? This infographic on the company's intrinsic value has everything you need to know.
Is AUB Group Using Its Retained Earnings Effectively?
The high three-year median payout ratio of 64% (or a retention ratio of 36%) for AUB Group suggests that the company's growth wasn't really hampered despite it returning most of its income to its shareholders.
Moreover, AUB Group is determined to keep sharing its profits with shareholders which we infer from its long history of paying a dividend for at least ten years. Our latest analyst data shows that the future payout ratio of the company over the next three years is expected to be approximately 58%. However, AUB Group's ROE is predicted to rise to 12% despite there being no anticipated change in its payout ratio.
Conclusion
Overall, we feel that AUB Group certainly does have some positive factors to consider. That is, quite an impressive growth in earnings. However, the low profit retention means that the company's earnings growth could have been higher, had it been reinvesting a higher portion of its profits. The latest industry analyst forecasts show that the company is expected to maintain its current growth rate. To know more about the company's future earnings growth forecasts take a look at this free report on analyst forecasts for the company to find out more.
If you're looking to trade AUB Group, open an account with the lowest-cost platform trusted by professionals, Interactive Brokers.
With clients in over 200 countries and territories, and access to 160 markets, IBKR lets you trade stocks, options, futures, forex, bonds and funds from a single integrated account.
Enjoy no hidden fees, no account minimums, and FX conversion rates as low as 0.03%, far better than what most brokers offer.
Sponsored ContentNew: Manage All Your Stock Portfolios in One Place
We've created the ultimate portfolio companion for stock investors, and it's free.
• Connect an unlimited number of Portfolios and see your total in one currency
• Be alerted to new Warning Signs or Risks via email or mobile
• Track the Fair Value of your stocks
Have feedback on this article? Concerned about the content? Get in touch with us directly. Alternatively, email editorial-team (at) simplywallst.com.
This article by Simply Wall St is general in nature. We provide commentary based on historical data and analyst forecasts only using an unbiased methodology and our articles are not intended to be financial advice. It does not constitute a recommendation to buy or sell any stock, and does not take account of your objectives, or your financial situation. We aim to bring you long-term focused analysis driven by fundamental data. Note that our analysis may not factor in the latest price-sensitive company announcements or qualitative material. Simply Wall St has no position in any stocks mentioned.
About ASX:AUB
AUB Group
Engages in the insurance broking and underwriting businesses in Australia and New Zealand.
Adequate balance sheet average dividend payer.
Similar Companies
Market Insights

Community Narratives
