- United Arab Emirates
- /
- Banks
- /
- DFM:EMIRATESNBD
Emirates NBD Bank PJSC's (DFM:EMIRATESNBD) investors will be pleased with their favorable 77% return over the last three years


Investors can buy low cost index fund if they want to receive the average market return. But in any diversified portfolio of stocks, you'll see some that fall short of the average. Unfortunately for shareholders, while the Emirates NBD Bank PJSC (DFM:EMIRATESNBD) share price is up 58% in the last three years, that falls short of the market return. In the last year the stock price gained, albeit only 5.0%.
So let's assess the underlying fundamentals over the last 3 years and see if they've moved in lock-step with shareholder returns.
Check out our latest analysis for Emirates NBD Bank PJSC
SWOT Analysis for Emirates NBD Bank PJSC
- Earnings growth over the past year exceeded the industry.
- Debt is well covered by earnings.
- Dividends are currently covered by earnings and forecast to be covered by earnings in 3 years.
- Dividend is low compared to the top 25% of dividend payers in the Banks market.
- Good value based on P/E ratio and estimated fair value.
- Debt is not well covered by operating cash flow.
- Annual earnings are forecast to decline for the next 3 years.
While the efficient markets hypothesis continues to be taught by some, it has been proven that markets are over-reactive dynamic systems, and investors are not always rational. One flawed but reasonable way to assess how sentiment around a company has changed is to compare the earnings per share (EPS) with the share price.
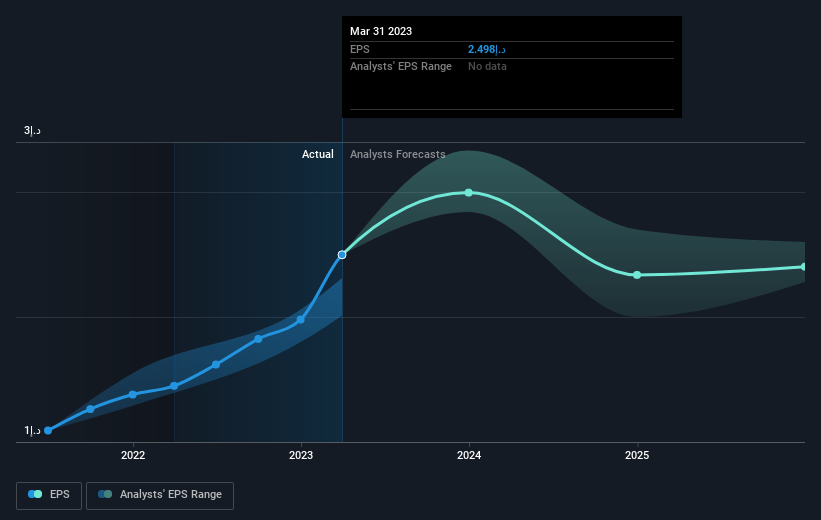
Emirates NBD Bank PJSC was able to grow its EPS at 16% per year over three years, sending the share price higher. Notably, the 16% average annual share price gain matches up nicely with the EPS growth rate. This suggests that sentiment and expectations have not changed drastically. Quite to the contrary, the share price has arguably reflected the EPS growth.
You can see below how EPS has changed over time (discover the exact values by clicking on the image).
We know that Emirates NBD Bank PJSC has improved its bottom line lately, but is it going to grow revenue? Check if analysts think Emirates NBD Bank PJSC will grow revenue in the future.
What About Dividends?
It is important to consider the total shareholder return, as well as the share price return, for any given stock. The TSR is a return calculation that accounts for the value of cash dividends (assuming that any dividend received was reinvested) and the calculated value of any discounted capital raisings and spin-offs. Arguably, the TSR gives a more comprehensive picture of the return generated by a stock. We note that for Emirates NBD Bank PJSC the TSR over the last 3 years was 77%, which is better than the share price return mentioned above. The dividends paid by the company have thusly boosted the total shareholder return.
A Different Perspective
Emirates NBD Bank PJSC shareholders are up 9.9% for the year (even including dividends). Unfortunately this falls short of the market return. On the bright side, the longer term returns (running at about 11% a year, over half a decade) look better. It's quite possible the business continues to execute with prowess, even as the share price gains are slowing. I find it very interesting to look at share price over the long term as a proxy for business performance. But to truly gain insight, we need to consider other information, too. For example, we've discovered 2 warning signs for Emirates NBD Bank PJSC that you should be aware of before investing here.
If you are like me, then you will not want to miss this free list of growing companies that insiders are buying.
Please note, the market returns quoted in this article reflect the market weighted average returns of stocks that currently trade on Emirian exchanges.
Valuation is complex, but we're here to simplify it.
Discover if Emirates NBD Bank PJSC might be undervalued or overvalued with our detailed analysis, featuring fair value estimates, potential risks, dividends, insider trades, and its financial condition.
Access Free AnalysisHave feedback on this article? Concerned about the content? Get in touch with us directly. Alternatively, email editorial-team (at) simplywallst.com.
This article by Simply Wall St is general in nature. We provide commentary based on historical data and analyst forecasts only using an unbiased methodology and our articles are not intended to be financial advice. It does not constitute a recommendation to buy or sell any stock, and does not take account of your objectives, or your financial situation. We aim to bring you long-term focused analysis driven by fundamental data. Note that our analysis may not factor in the latest price-sensitive company announcements or qualitative material. Simply Wall St has no position in any stocks mentioned.
About DFM:EMIRATESNBD
Emirates NBD Bank PJSC
Provides corporate, institutional, retail, treasury, and Islamic banking services.
Excellent balance sheet established dividend payer.
Similar Companies
Market Insights

Community Narratives


