Advertisement
- United Kingdom
- /
- Specialty Stores
- /
- LSE:ASC
Should You Worry About ASOS Plc’s (LON:ASC) ROCE?
Today we are going to look at ASOS Plc (LON:ASC) to see whether it might be an attractive investment prospect. In particular, we'll consider its Return On Capital Employed (ROCE), as that can give us insight into how profitably the company is able to employ capital in its business.
First, we'll go over how we calculate ROCE. Next, we'll compare it to others in its industry. Then we'll determine how its current liabilities are affecting its ROCE.
What is Return On Capital Employed (ROCE)?
ROCE measures the amount of pre-tax profits a company can generate from the capital employed in its business. In general, businesses with a higher ROCE are usually better quality. Overall, it is a valuable metric that has its flaws. Author Edwin Whiting says to be careful when comparing the ROCE of different businesses, since 'No two businesses are exactly alike.
How Do You Calculate Return On Capital Employed?
Analysts use this formula to calculate return on capital employed:
Return on Capital Employed = Earnings Before Interest and Tax (EBIT) ÷ (Total Assets - Current Liabilities)
Or for ASOS:
0.074 = UK£35m ÷ (UK£1.2b - UK£772m) (Based on the trailing twelve months to August 2019.)
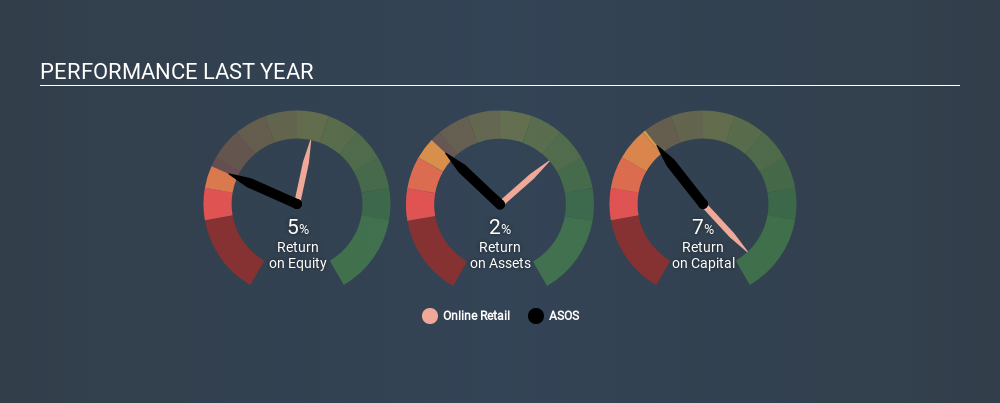
So, ASOS has an ROCE of 7.4%.
See our latest analysis for ASOS
Does ASOS Have A Good ROCE?
When making comparisons between similar businesses, investors may find ROCE useful. In this analysis, ASOS's ROCE appears meaningfully below the 12% average reported by the Online Retail industry. This could be seen as a negative, as it suggests some competitors may be employing their capital more efficiently. Setting aside the industry comparison for now, ASOS's ROCE is mediocre in absolute terms, considering the risk of investing in stocks versus the safety of a bank account. Readers may find more attractive investment prospects elsewhere.
ASOS's current ROCE of 7.4% is lower than its ROCE in the past, which was 28%, 3 years ago. So investors might consider if it has had issues recently. You can click on the image below to see (in greater detail) how ASOS's past growth compares to other companies.
When considering this metric, keep in mind that it is backwards looking, and not necessarily predictive. ROCE can be misleading for companies in cyclical industries, with returns looking impressive during the boom times, but very weak during the busts. ROCE is only a point-in-time measure. What happens in the future is pretty important for investors, so we have prepared a free report on analyst forecasts for ASOS.
How ASOS's Current Liabilities Impact Its ROCE
Current liabilities are short term bills and invoices that need to be paid in 12 months or less. The ROCE equation subtracts current liabilities from capital employed, so a company with a lot of current liabilities appears to have less capital employed, and a higher ROCE than otherwise. To counter this, investors can check if a company has high current liabilities relative to total assets.
ASOS has total liabilities of UK£772m and total assets of UK£1.2b. Therefore its current liabilities are equivalent to approximately 62% of its total assets. With a high level of current liabilities, ASOS will experience a boost to its ROCE.
The Bottom Line On ASOS's ROCE
Even so, the company reports a mediocre ROCE, and there may be better investments out there. But note: make sure you look for a great company, not just the first idea you come across. So take a peek at this free list of interesting companies with strong recent earnings growth (and a P/E ratio below 20).
If you like to buy stocks alongside management, then you might just love this free list of companies. (Hint: insiders have been buying them).
If you spot an error that warrants correction, please contact the editor at editorial-team@simplywallst.com. This article by Simply Wall St is general in nature. It does not constitute a recommendation to buy or sell any stock, and does not take account of your objectives, or your financial situation. Simply Wall St has no position in the stocks mentioned.
We aim to bring you long-term focused research analysis driven by fundamental data. Note that our analysis may not factor in the latest price-sensitive company announcements or qualitative material. Thank you for reading.
About LSE:ASC
ASOS
Operates as an online fashion retailer in the United Kingdom, the European Union, the United States, and internationally.
Fair value with imperfect balance sheet.
Similar Companies
Market Insights


Advertisement
Weekly Picks
LO


Lou_Basenese on Optimi Health ·
The Only Psychedelic Company Already Selling MDMA and Psilocybin to Real Patients, Yet Priced Like It Doesn’t Exist
Fair Value:US$1157.5% undervalued
37 followersusers have followed this narrative
2 commentsusers have commented on this narrative
6 likesusers have liked this narrative
WE


WealthAP on Novo Nordisk ·
Novo Nordisk (NVO): Is the "Easy Growth" Story Over?
Fair Value:DKK 407.7721.4% undervalued
59 followersusers have followed this narrative
0 commentsusers have commented on this narrative
7 likesusers have liked this narrative
VA


ValueInvestingSubstack on Zoetis ·
Zoetis down -50% over the past year
Fair Value:US$92.9218.9% undervalued
21 followersusers have followed this narrative
0 commentsusers have commented on this narrative
8 likesusers have liked this narrative
CE


CentryResearch on Centrus Energy ·
Centrus Energy: The Next Nuclear Bottleneck Isn't Reactors. It's Fuel.
Fair Value:US$19013.7% undervalued
19 followersusers have followed this narrative
0 commentsusers have commented on this narrative
9 likesusers have liked this narrative
Recently Updated Narratives
AE

Aequitas on ASML Holding ·
ASML Will Reign as the Kingpin of the Semiconductor Supply Chain
Fair Value:€1.87k16.5% undervalued
1 followerusers have followed this narrative
0 commentsusers have commented on this narrative
0 likesusers have liked this narrative
AE

Aequitas on Fortinet ·
Fortinet, compounding Cyber Security Player.
Fair Value:US$116.8430.4% overvalued
1 followerusers have followed this narrative
0 commentsusers have commented on this narrative
0 likesusers have liked this narrative
AE

Aequitas on Constellation Software ·
Constellation Software: A Proven Serial Acquirer at a Discount
Fair Value:CA$3.72k28.3% undervalued
1 followerusers have followed this narrative
0 commentsusers have commented on this narrative
0 likesusers have liked this narrative
Popular Narratives
BE

benjamin_lvieq on PayPal Holdings ·
PayPal: PayPal Doesn't Need to Grow – It Needs to Stop Falling – A Mispriced Cash Machine With a Cannibal Buyback
Fair Value:US$6513.6% undervalued
70 followersusers have followed this narrative
2 commentsusers have commented on this narrative
11 likesusers have liked this narrative
CU

CubanEros on Microsoft ·
A wonderful business at reasonable price.
Fair Value:US$419.919.1% undervalued
70 followersusers have followed this narrative
0 commentsusers have commented on this narrative
5 likesusers have liked this narrative
TR


tripledub on Alphabet ·
Warren Buffett Just Bet $10 Billion on Google. The Catch? You May Already Be Too Late.
Fair Value:US$23039.0% overvalued
92 followersusers have followed this narrative
1 commentusers have commented on this narrative
18 likesusers have liked this narrative