Advertisement
- United States
- /
- Biotech
- /
- NasdaqGS:SANA
Paysign Leads Our Trio Of Penny Stock Highlights

Simply Wall St
Reviewed by Simply Wall St
The market has climbed 1.3% over the last week and is up 13% over the past year, with earnings forecasted to grow by 14% annually. For those looking to invest in smaller or newer companies, penny stocks—despite their vintage name—can still offer surprising value. We've selected three examples of penny stocks that combine balance sheet strength with potential for outsized gains, giving investors the chance to discover hidden value in quality companies.
Top 10 Penny Stocks In The United States
| Name | Share Price | Market Cap | Rewards & Risks |
| SideChannel (SDCH) | $0.04755 | $11.56M | ✅ 4 ⚠️ 2 View Analysis > |
| Imperial Petroleum (IMPP) | $3.02 | $106.34M | ✅ 4 ⚠️ 1 View Analysis > |
| New Horizon Aircraft (HOVR) | $1.12 | $34.21M | ✅ 4 ⚠️ 5 View Analysis > |
| Waterdrop (WDH) | $1.43 | $531.64M | ✅ 4 ⚠️ 0 View Analysis > |
| WM Technology (MAPS) | $1.13 | $186.68M | ✅ 4 ⚠️ 1 View Analysis > |
| Perfect (PERF) | $1.81 | $182.31M | ✅ 4 ⚠️ 0 View Analysis > |
| Table Trac (TBTC) | $4.72 | $21.94M | ✅ 2 ⚠️ 2 View Analysis > |
| Flexible Solutions International (FSI) | $4.31 | $54.7M | ✅ 1 ⚠️ 2 View Analysis > |
| BAB (BABB) | $0.8265 | $6.17M | ✅ 2 ⚠️ 3 View Analysis > |
| Lifetime Brands (LCUT) | $4.12 | $84.5M | ✅ 3 ⚠️ 2 View Analysis > |
Click here to see the full list of 708 stocks from our US Penny Stocks screener.
Let's dive into some prime choices out of the screener.
Paysign (PAYS)
Simply Wall St Financial Health Rating: ★★★★★★
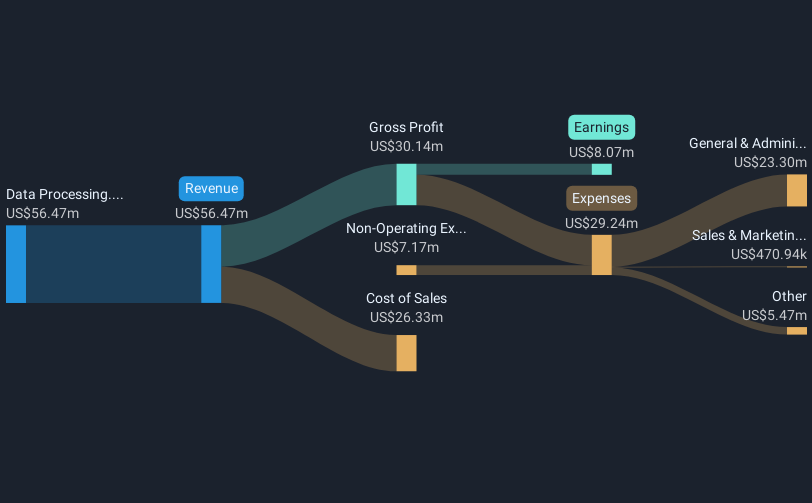
Overview: Paysign, Inc. offers prepaid card programs, patient affordability solutions, digital banking services, and integrated payment processing for various sectors with a market cap of $268.65 million.
Operations: Paysign generates revenue primarily from its data processing segment, which amounts to $63.79 million.
Market Cap: $268.65M
Paysign, Inc. has demonstrated a stable financial position with no debt and sufficient short-term assets to cover liabilities. Recent developments include the addition of 132 plasma donation centers, expanding its market share to approximately 50% in the U.S., which is expected to drive immediate revenue growth without increasing SG&A expenses. Despite a decline in profit margins from 13.8% to 9.6%, Paysign's earnings have grown significantly over five years at an annual rate of 43.5%. The company recently appointed Baker Tilly as its new auditor following a merger involving Moss Adams LLP, reflecting ongoing corporate adjustments.
- Click here and access our complete financial health analysis report to understand the dynamics of Paysign.
- Learn about Paysign's future growth trajectory here.
Sana Biotechnology (SANA)
Simply Wall St Financial Health Rating: ★★★★★☆
Overview: Sana Biotechnology, Inc. is a biotechnology company that focuses on utilizing engineered cells as medicines in the United States, with a market cap of approximately $638.32 million.
Operations: Sana Biotechnology does not currently report any revenue segments.
Market Cap: $638.32M
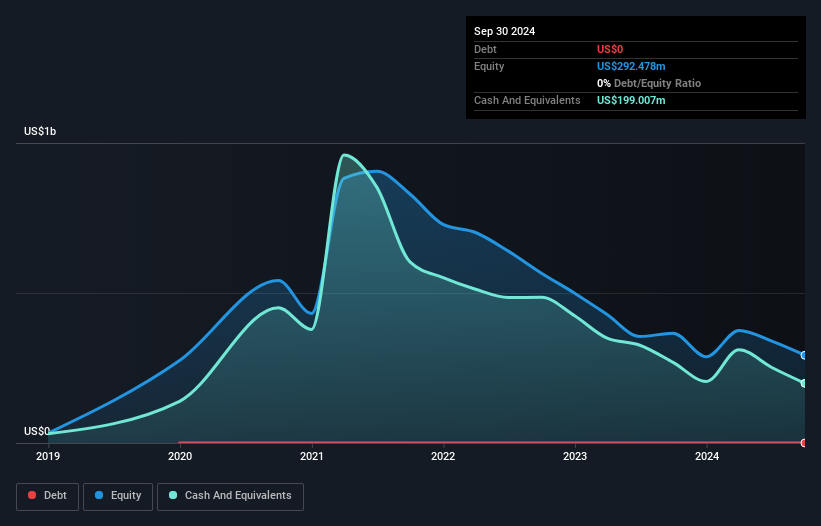
Sana Biotechnology, a pre-revenue company with a market cap of US$638.32 million, remains unprofitable but has reduced its losses over the past five years by 4.2% annually. Despite having no debt and short-term assets exceeding liabilities, long-term liabilities remain uncovered. Recent capital raises include a US$119 million equity offering to extend its cash runway beyond the current six months based on free cash flow estimates. The management team is relatively new with an average tenure of 1.4 years, and ongoing legal challenges may impact investor sentiment as they address allegations of misleading financial statements and operational risks.
- Get an in-depth perspective on Sana Biotechnology's performance by reading our balance sheet health report here.
- Examine Sana Biotechnology's earnings growth report to understand how analysts expect it to perform.
NIO (NIO)
Simply Wall St Financial Health Rating: ★★★★★☆
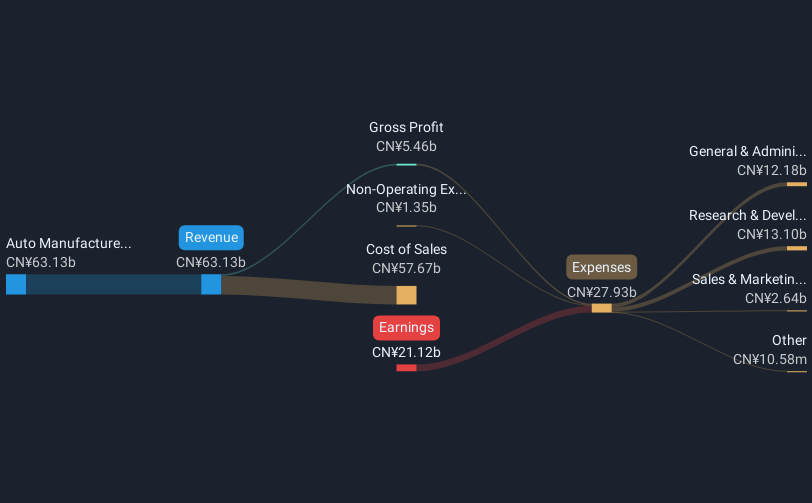
Overview: NIO Inc. designs, develops, manufactures, and sells smart electric vehicles in China, Europe, and internationally with a market cap of approximately $8.07 billion.
Operations: The company generates revenue primarily from its Smart Electric Vehicles Related Business, totaling CN¥67.86 billion.
Market Cap: $8.07B
NIO Inc., with a market cap of approximately $8.07 billion, is unprofitable and has seen its losses grow by 26.2% annually over the past five years. Despite this, NIO's revenue is forecast to grow by 18.64% annually, supported by vehicle deliveries that increased year-over-year in recent months. The company reported a net loss for Q1 2025 but continues to enhance its strategic partnerships and technological capabilities, such as through collaborations on aerodynamic optimization with Flexcompute. NIO's short-term assets exceed long-term liabilities, though they fall short of covering short-term liabilities entirely.
- Click here to discover the nuances of NIO with our detailed analytical financial health report.
- Review our growth performance report to gain insights into NIO's future.
Seize The Opportunity
- Click through to start exploring the rest of the 705 US Penny Stocks now.
- Ready For A Different Approach? The latest GPUs need a type of rare earth metal called Terbium and there are only 24 companies in the world exploring or producing it. Find the list for free.
This article by Simply Wall St is general in nature. We provide commentary based on historical data and analyst forecasts only using an unbiased methodology and our articles are not intended to be financial advice. It does not constitute a recommendation to buy or sell any stock, and does not take account of your objectives, or your financial situation. We aim to bring you long-term focused analysis driven by fundamental data. Note that our analysis may not factor in the latest price-sensitive company announcements or qualitative material. Simply Wall St has no position in any stocks mentioned.
New: Manage All Your Stock Portfolios in One Place
We've created the ultimate portfolio companion for stock investors, and it's free.
• Connect an unlimited number of Portfolios and see your total in one currency
• Be alerted to new Warning Signs or Risks via email or mobile
• Track the Fair Value of your stocks
Have feedback on this article? Concerned about the content? Get in touch with us directly. Alternatively, email editorial-team@simplywallst.com
About NasdaqGS:SANA
Sana Biotechnology
A biotechnology company, focuses on utilizing engineered cells as medicines in the United States.
Excellent balance sheet with moderate risk.
Similar Companies
Market Insights


Advertisement
Community Narratives
America Wants Homegrown Drones — Draganfly Is Ready to Deliver
Fair Value US$9.21|27.4% undervalued
JO
Community Contributor
Cheesecake Factory offers an enticing opportunity for long-term growth by leveraging new concepts
Fair Value US$73.83|25.8% undervalued
ZW
Community Contributor
Coca-Cola’s Intrinsic Value Set to Rise with Fed Rate Cut
Fair Value US$67.50|2.7% undervalued
AL
Community Contributor
Fully Permitted Gold Mine with 50 Baggers Potential 
Fair Value CA$41.00|98.0% undervalued
RO
Community Contributor