- United States
- /
- Other Utilities
- /
- NYSE:PEG
A Close Look At Public Service Enterprise Group Incorporated’s (NYSE:PEG) 5.9% ROCE

Today we'll evaluate Public Service Enterprise Group Incorporated (NYSE:PEG) to determine whether it could have potential as an investment idea. In particular, we'll consider its Return On Capital Employed (ROCE), as that can give us insight into how profitably the company is able to employ capital in its business.
First of all, we'll work out how to calculate ROCE. Next, we'll compare it to others in its industry. Finally, we'll look at how its current liabilities affect its ROCE.
What is Return On Capital Employed (ROCE)?
ROCE measures the 'return' (pre-tax profit) a company generates from capital employed in its business. All else being equal, a better business will have a higher ROCE. Overall, it is a valuable metric that has its flaws. Renowned investment researcher Michael Mauboussin has suggested that a high ROCE can indicate that 'one dollar invested in the company generates value of more than one dollar'.
So, How Do We Calculate ROCE?
Analysts use this formula to calculate return on capital employed:
Return on Capital Employed = Earnings Before Interest and Tax (EBIT) ÷ (Total Assets - Current Liabilities)
Or for Public Service Enterprise Group:
0.059 = US$2.5b ÷ (US$46b - US$4.0b) (Based on the trailing twelve months to June 2019.)
Therefore, Public Service Enterprise Group has an ROCE of 5.9%.
Check out our latest analysis for Public Service Enterprise Group
Is Public Service Enterprise Group's ROCE Good?
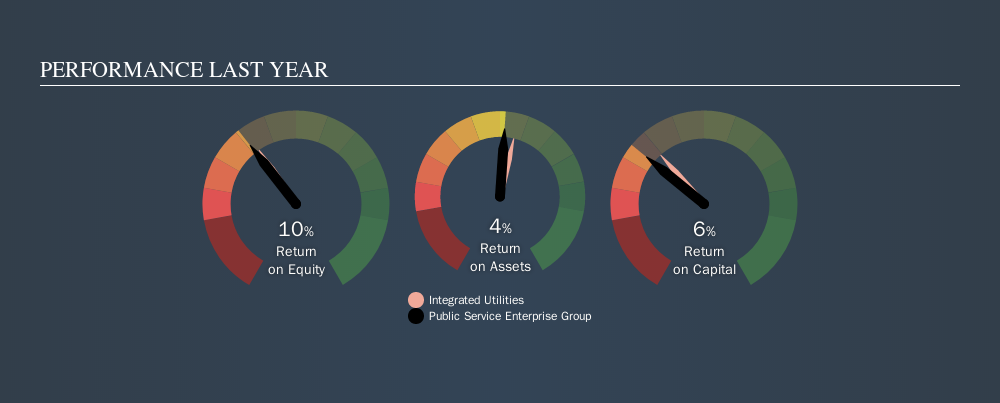
One way to assess ROCE is to compare similar companies. In our analysis, Public Service Enterprise Group's ROCE is meaningfully higher than the 4.9% average in the Integrated Utilities industry. I think that's good to see, since it implies the company is better than other companies at making the most of its capital. Setting aside the industry comparison for now, Public Service Enterprise Group's ROCE is mediocre in absolute terms, considering the risk of investing in stocks versus the safety of a bank account. Investors may wish to consider higher-performing investments.
The image below shows how Public Service Enterprise Group's ROCE compares to its industry.
Remember that this metric is backwards looking - it shows what has happened in the past, and does not accurately predict the future. ROCE can be deceptive for cyclical businesses, as returns can look incredible in boom times, and terribly low in downturns. ROCE is, after all, simply a snap shot of a single year. Future performance is what matters, and you can see analyst predictions in our free report on analyst forecasts for the company.
What Are Current Liabilities, And How Do They Affect Public Service Enterprise Group's ROCE?
Liabilities, such as supplier bills and bank overdrafts, are referred to as current liabilities if they need to be paid within 12 months. The ROCE equation subtracts current liabilities from capital employed, so a company with a lot of current liabilities appears to have less capital employed, and a higher ROCE than otherwise. To counter this, investors can check if a company has high current liabilities relative to total assets.
Public Service Enterprise Group has total liabilities of US$4.0b and total assets of US$46b. Therefore its current liabilities are equivalent to approximately 8.6% of its total assets. With low levels of current liabilities, at least Public Service Enterprise Group's mediocre ROCE is not unduly boosted.
Our Take On Public Service Enterprise Group's ROCE
Public Service Enterprise Group looks like an ok business, but on this analysis it is not at the top of our buy list. You might be able to find a better investment than Public Service Enterprise Group. If you want a selection of possible winners, check out this free list of interesting companies that trade on a P/E below 20 (but have proven they can grow earnings).
If you are like me, then you will not want to miss this free list of growing companies that insiders are buying.
We aim to bring you long-term focused research analysis driven by fundamental data. Note that our analysis may not factor in the latest price-sensitive company announcements or qualitative material.
If you spot an error that warrants correction, please contact the editor at editorial-team@simplywallst.com. This article by Simply Wall St is general in nature. It does not constitute a recommendation to buy or sell any stock, and does not take account of your objectives, or your financial situation. Simply Wall St has no position in the stocks mentioned. Thank you for reading.
About NYSE:PEG
Public Service Enterprise Group
Through its subsidiaries, operates in electric and gas utility, and nuclear generation businesses in the United States.
Average dividend payer with questionable track record.
Similar Companies
Market Insights

Weekly Picks

THE KINGDOM OF BROWN GOODS: WHY MGPI IS BEING CRUSHED BY INVENTORY & PRIMED FOR RESURRECTION


Why Vertical Aerospace (NYSE: EVTL) is Worth Possibly Over 13x its Current Price


The Quiet Giant That Became AI’s Power Grid
Recently Updated Narratives

Agfa-Gevaert is a digital and materials turnaround opportunity, with growth potential in ZIRFON, but carrying legacy risks.

Hitit Bilgisayar Hizmetleri will achieve a 19.7% revenue boost in the next five years


MINISO's fair value is projected at 26.69 with an anticipated PE ratio shift of 20x
Popular Narratives


MicroVision will explode future revenue by 380.37% with a vision towards success


Crazy Undervalued 42 Baggers Silver Play (Active & Running Mine)


