
Advertisement
Legendary fund manager Li Lu (who Charlie Munger backed) once said, 'The biggest investment risk is not the volatility of prices, but whether you will suffer a permanent loss of capital.' So it might be obvious that you need to consider debt, when you think about how risky any given stock is, because too much debt can sink a company. Importantly, NiSource Inc. (NYSE:NI) does carry debt. But the real question is whether this debt is making the company risky.
Why Does Debt Bring Risk?
Debt assists a business until the business has trouble paying it off, either with new capital or with free cash flow. In the worst case scenario, a company can go bankrupt if it cannot pay its creditors. While that is not too common, we often do see indebted companies permanently diluting shareholders because lenders force them to raise capital at a distressed price. Of course, the upside of debt is that it often represents cheap capital, especially when it replaces dilution in a company with the ability to reinvest at high rates of return. The first step when considering a company's debt levels is to consider its cash and debt together.
What Is NiSource's Net Debt?
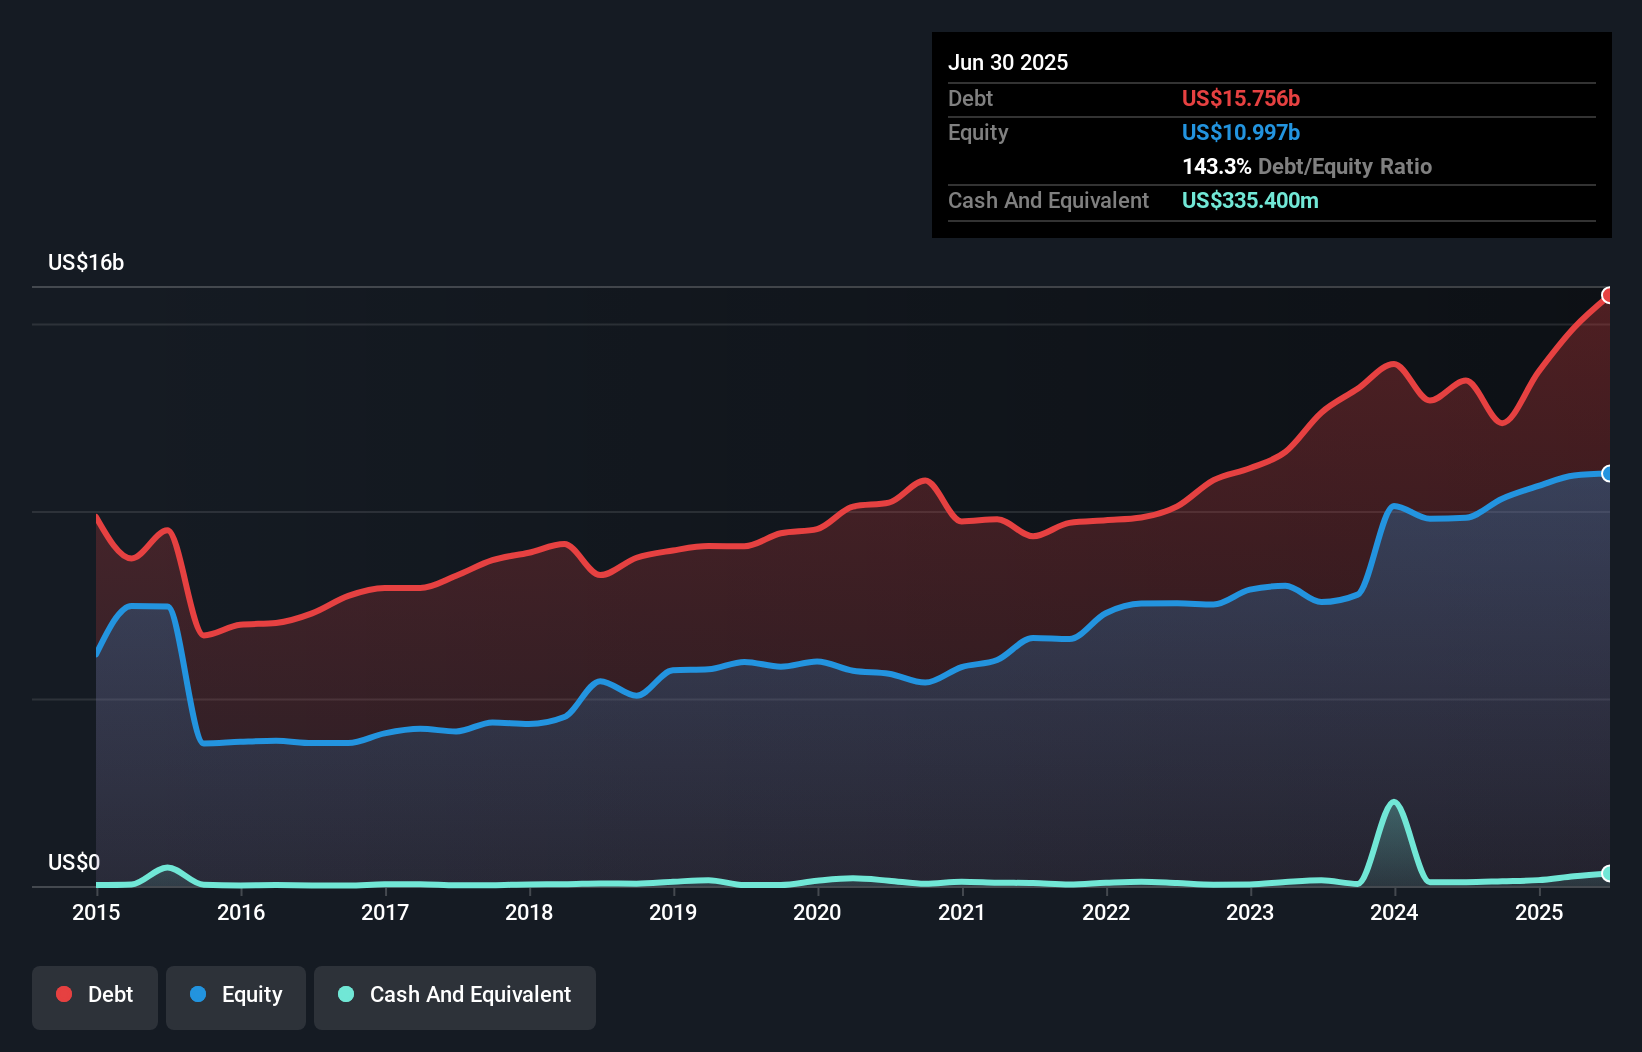
As you can see below, at the end of June 2025, NiSource had US$15.8b of debt, up from US$13.5b a year ago. Click the image for more detail. On the flip side, it has US$335.4m in cash leading to net debt of about US$15.4b.
A Look At NiSource's Liabilities
According to the last reported balance sheet, NiSource had liabilities of US$3.41b due within 12 months, and liabilities of US$19.6b due beyond 12 months. On the other hand, it had cash of US$335.4m and US$811.6m worth of receivables due within a year. So it has liabilities totalling US$21.9b more than its cash and near-term receivables, combined.
When you consider that this deficiency exceeds the company's huge US$20.6b market capitalization, you might well be inclined to review the balance sheet intently. In the scenario where the company had to clean up its balance sheet quickly, it seems likely shareholders would suffer extensive dilution.
Check out our latest analysis for NiSource
In order to size up a company's debt relative to its earnings, we calculate its net debt divided by its earnings before interest, tax, depreciation, and amortization (EBITDA) and its earnings before interest and tax (EBIT) divided by its interest expense (its interest cover). This way, we consider both the absolute quantum of the debt, as well as the interest rates paid on it.
NiSource has a rather high debt to EBITDA ratio of 5.8 which suggests a meaningful debt load. However, its interest coverage of 2.8 is reasonably strong, which is a good sign. However, one redeeming factor is that NiSource grew its EBIT at 17% over the last 12 months, boosting its ability to handle its debt. There's no doubt that we learn most about debt from the balance sheet. But it is future earnings, more than anything, that will determine NiSource's ability to maintain a healthy balance sheet going forward. So if you're focused on the future you can check out this free report showing analyst profit forecasts.
Finally, a company can only pay off debt with cold hard cash, not accounting profits. So the logical step is to look at the proportion of that EBIT that is matched by actual free cash flow. Over the last three years, NiSource saw substantial negative free cash flow, in total. While investors are no doubt expecting a reversal of that situation in due course, it clearly does mean its use of debt is more risky.
Our View
To be frank both NiSource's net debt to EBITDA and its track record of converting EBIT to free cash flow make us rather uncomfortable with its debt levels. But at least it's pretty decent at growing its EBIT; that's encouraging. We should also note that Integrated Utilities industry companies like NiSource commonly do use debt without problems. We're quite clear that we consider NiSource to be really rather risky, as a result of its balance sheet health. So we're almost as wary of this stock as a hungry kitten is about falling into its owner's fish pond: once bitten, twice shy, as they say. When analysing debt levels, the balance sheet is the obvious place to start. However, not all investment risk resides within the balance sheet - far from it. Case in point: We've spotted 2 warning signs for NiSource you should be aware of, and 1 of them shouldn't be ignored.
If you're interested in investing in businesses that can grow profits without the burden of debt, then check out this free list of growing businesses that have net cash on the balance sheet.
Valuation is complex, but we're here to simplify it.
Discover if NiSource might be undervalued or overvalued with our detailed analysis, featuring fair value estimates, potential risks, dividends, insider trades, and its financial condition.
Access Free AnalysisHave feedback on this article? Concerned about the content? Get in touch with us directly. Alternatively, email editorial-team (at) simplywallst.com.
This article by Simply Wall St is general in nature. We provide commentary based on historical data and analyst forecasts only using an unbiased methodology and our articles are not intended to be financial advice. It does not constitute a recommendation to buy or sell any stock, and does not take account of your objectives, or your financial situation. We aim to bring you long-term focused analysis driven by fundamental data. Note that our analysis may not factor in the latest price-sensitive company announcements or qualitative material. Simply Wall St has no position in any stocks mentioned.
About NYSE:NI
NiSource
An energy holding company, operates as a regulated natural gas and electric utility company in the United States.
Proven track record second-rate dividend payer.
Similar Companies
Market Insights

Advertisement
Weekly Picks
WO

woodworthfund on MGP Ingredients ·
THE KINGDOM OF BROWN GOODS: WHY MGPI IS BEING CRUSHED BY INVENTORY & PRIMED FOR RESURRECTION
Fair Value:US$4034.1% undervalued
18 followersusers have followed this narrative
1 commentusers have commented on this narrative
4 likesusers have liked this narrative
DO


Double_Bubbler on Vertical Aerospace ·
Why Vertical Aerospace (NYSE: EVTL) is Worth Possibly Over 13x its Current Price
Fair Value:US$6090.0% undervalued
21 followersusers have followed this narrative
2 commentsusers have commented on this narrative
17 likesusers have liked this narrative
TI


TickerTickle on Oracle ·
The Quiet Giant That Became AI’s Power Grid
Fair Value:US$389.8142.8% undervalued
41 followersusers have followed this narrative
3 commentsusers have commented on this narrative
8 likesusers have liked this narrative
Recently Updated Narratives
MH


mhbb on Mastersystem Infotama ·
Mastersystem Infotama will achieve 18.9% revenue growth as fair value hits IDR1,650
Fair Value:Rp1.63k13.8% undervalued
1 followerusers have followed this narrative
0 commentsusers have commented on this narrative
0 likesusers have liked this narrative
RO


Robbo on Procter & Gamble ·
Insiders Sell, Investors Watch: What’s Going On at PG?
Fair Value:US$1506.8% undervalued
1 followerusers have followed this narrative
0 commentsusers have commented on this narrative
0 likesusers have liked this narrative
CW

Cwburton on Verano Holdings ·
Waiting for the Inevitable
Fair Value:CA$5.5278.8% undervalued
2 followersusers have followed this narrative
0 commentsusers have commented on this narrative
0 likesusers have liked this narrative
Popular Narratives
TH


TheWallstreetKing on MicroVision ·
MicroVision will explode future revenue by 380.37% with a vision towards success
Fair Value:US$6098.5% undervalued
119 followersusers have followed this narrative
11 commentsusers have commented on this narrative
22 likesusers have liked this narrative
AN


AnalystConsensusTarget on NVIDIA ·
NVDA: Expanding AI Demand Will Drive Major Data Center Investments Through 2026
Fair Value:US$250.3926.6% undervalued
962 followersusers have followed this narrative
6 commentsusers have commented on this narrative
25 likesusers have liked this narrative
RO


RockeTeller on Santacruz Silver Mining ·
Crazy Undervalued 42 Baggers Silver Play (Active & Running Mine)
Fair Value:CA$8684.3% undervalued
77 followersusers have followed this narrative
8 commentsusers have commented on this narrative
21 likesusers have liked this narrative
Trending Discussion

OI


OilStates on Oil States International ·
This article is overall well written. However, to correct a few points and to highlight a few additional points: -The shift towards more stable long-cycle offshore and international projects does not increase volatility or exposure to short-cycle markets, quite the opposite. Offshore projects have a much longer investment cycle, duration, and low volatility given these are multi-decade assets. -The article notes a lack of exposure to renewables. Oil States has applied decades of experience in technologies for traditional oil & gas technologies into the renewables sector including transfer of fixed and floating offshore platform technologies into offshore wind, downhole perforating and well completions technologies into geothermal, along with over 50+ renewables projects completed. We are supportive of a broad energy mix, yet to meet growing global energy demand requires both traditional as well as lower carbon resources. Both elements as well as other industrial product orders continue to contribute to Oil States decade-high backlog, which provides significant future revenue visibility. -One of the main storylines not captured here is cash flow generation. 75% of Company revenues (up from 51% in 2022) now come from offshore and international work, which provides good margins. With the strength of the Offshore Manufactured Products business segment, the high-grading of U.S. domestic land activities to focus on higher margin business lines, free cash flow (a non-GAAP metric) has grown significantly ($70 million in free cash flow on a TTM basis as of Sept. 30, 2025). This is quite high for a Company at this market cap, which results in a higher free cash flow yield vs. peers. -Free cash is being used to repurchase shares, to pay down debt (nearing net-debt zero), and to increase returns to stockholders. More detail can be found in our latest investor presentation here: https://ir.oilstatesintl.com/events-and-presentations/default.aspx
0
|0