- United States
- /
- Renewable Energy
- /
- NYSE:CWEN.A
What Recent Gains and Power Purchase Deals Signal for Clearway Energy Stock in 2025

Reviewed by Bailey Pemberton
If you are trying to figure out whether now is the time to add Clearway Energy to your portfolio, you are definitely not alone. There is a lot of chatter among investors about this stock, and for good reason. Over the past year, Clearway has outpaced many expectations, notching a 21.8% gain and racking up a notable 40.1% increase over five years. Even just this year, the stock is up 19.5%, and the past month alone has seen a healthy 8.6% rise. A steady upward drift like this tends to grab attention, hinting at a mix of renewed optimism in the renewable energy sector as well as a fresh perspective on Clearway’s risk profile.
With so much momentum, it’s natural to start asking what’s behind these numbers. Is this growth justified, or are we looking at a stock that is running hot? That is where valuation comes in. A closer look at Clearway’s value score shows it rates a 4 out of 6, meaning it passes four different checks for being undervalued. That is a strong result, suggesting there could be more room to run, but valuation is a complex puzzle that goes far beyond just a single number.
Let’s dig into the methods investors use to assess whether a stock like Clearway Energy is truly undervalued and see how it measures up. Stick with me through the approaches most people use, because at the end, I will share what could be an even sharper way to value this company.
Why Clearway Energy is lagging behind its peers
Approach 1: Clearway Energy Discounted Cash Flow (DCF) Analysis
The Discounted Cash Flow (DCF) model projects a company’s future free cash flows and discounts them back to today’s value, aiming to estimate the intrinsic worth of a business. For Clearway Energy, the current Free Cash Flow stands at $511.5 Million. According to the 2 Stage Free Cash Flow to Equity approach, analysts forecast solid increases, with projections rising to $823 Million by 2027. Looking to the next decade, Simply Wall St extrapolates further growth and suggests Free Cash Flows could reach as high as approximately $2 Billion by 2035.
Using these forward-looking cash flows, the DCF model estimates Clearway Energy’s intrinsic value at $94.96 per share. This assessment represents a significant 68.8% discount from the current market price, meaning the stock appears substantially undervalued based on this method.
For investors looking at the numbers, the conclusion is hard to ignore. According to the DCF analysis, Clearway Energy’s valuation leaves a hefty margin of safety.
Result: UNDERVALUED
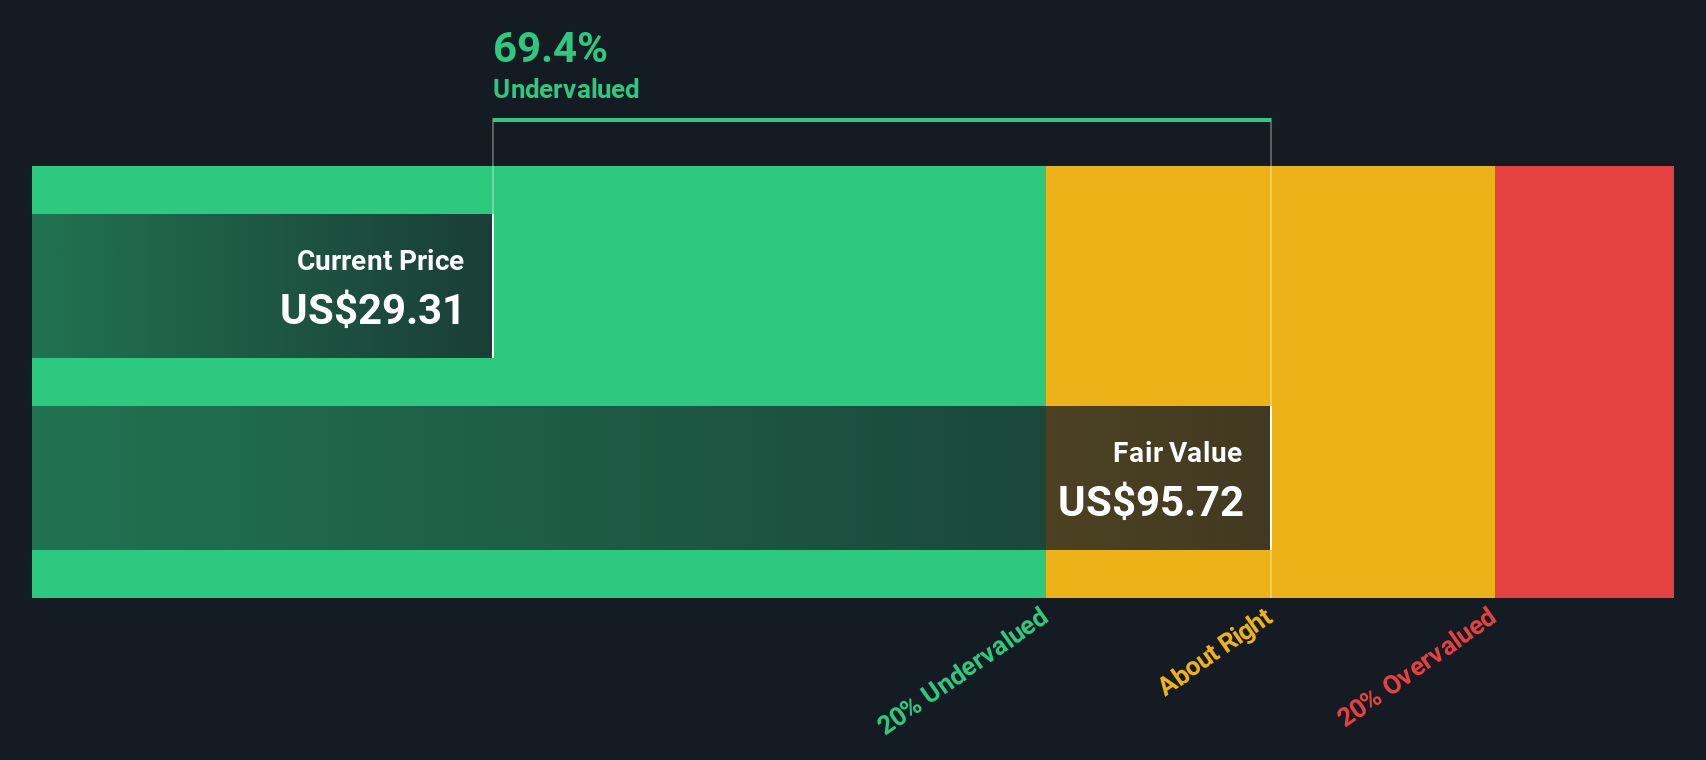
Our Discounted Cash Flow (DCF) analysis suggests Clearway Energy is undervalued by 68.8%. Track this in your watchlist or portfolio, or discover more undervalued stocks.
Approach 2: Clearway Energy Price vs Earnings
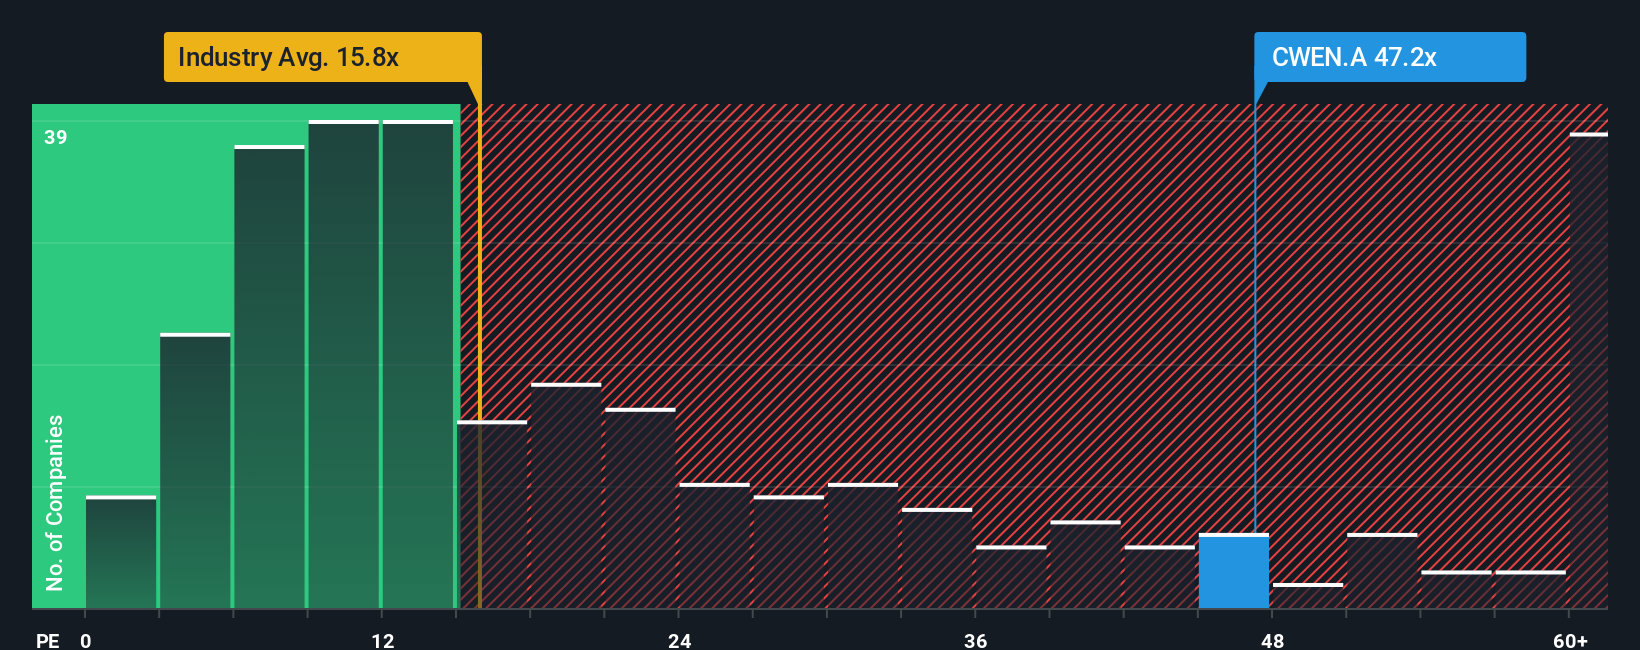
For companies with steady profits, the Price-to-Earnings (PE) ratio is one of the most widely used and meaningful metrics to judge valuation. It essentially tells you how much investors are willing to pay for each dollar of earnings. PE ratios tend to track a company’s growth prospects and the risks it faces. Faster-growing businesses or those with more predictable profits usually command higher multiples, while riskier or slower-growing ones often trade at lower PE ratios.
Clearway Energy currently trades at a PE ratio of 45.91x, compared to an industry average of 16.66x for renewable energy and a peer group average of 51.20x. At face value, Clearway’s multiple is significantly higher than the wider industry, but a little below the peer set. This may reflect better growth or a stronger position in the market. However, simply comparing raw PE ratios can be misleading, as different companies can have very different growth rates, profit margins, or risk profiles.
This is where the Simply Wall St "Fair Ratio" comes into play. The Fair Ratio for Clearway Energy stands at 32.60x, which is calculated by weighing factors like growth outlook, profitability, industry, market cap, and unique risks. This makes it a more balanced benchmark than the simple industry or peer average. Comparing the current PE of 45.91x to the Fair Ratio of 32.60x suggests that Clearway’s shares are currently trading above where you would expect given its fundamentals. This indicates some overvaluation by this measure.
Result: OVERVALUED
PE ratios tell one story, but what if the real opportunity lies elsewhere? Discover companies where insiders are betting big on explosive growth.
Upgrade Your Decision Making: Choose your Clearway Energy Narrative
Earlier in this article, we hinted at a smarter way to understand valuation, so let’s introduce Narratives. A Narrative is simply your story for a company, an explanation of why you think a stock is set to win, grow steadily, or lose ground, based on your own forecasts for its future revenue, earnings, margins, and fair value. Narratives connect the big picture of a company’s strategy, industry trends, and catalysts directly to detailed financial forecasts. This brings a company’s numbers to life and gives you a well-reasoned price target backed up by specific assumptions.
On Simply Wall St’s Community page, millions of investors use Narratives to see exactly how their views stack up alongside others, quickly comparing their own Fair Value to the current stock Price to decide if it’s time to buy or sell. These Narratives automatically update as new earnings reports, news, or events happen, so you always have the most relevant data guiding your decisions.
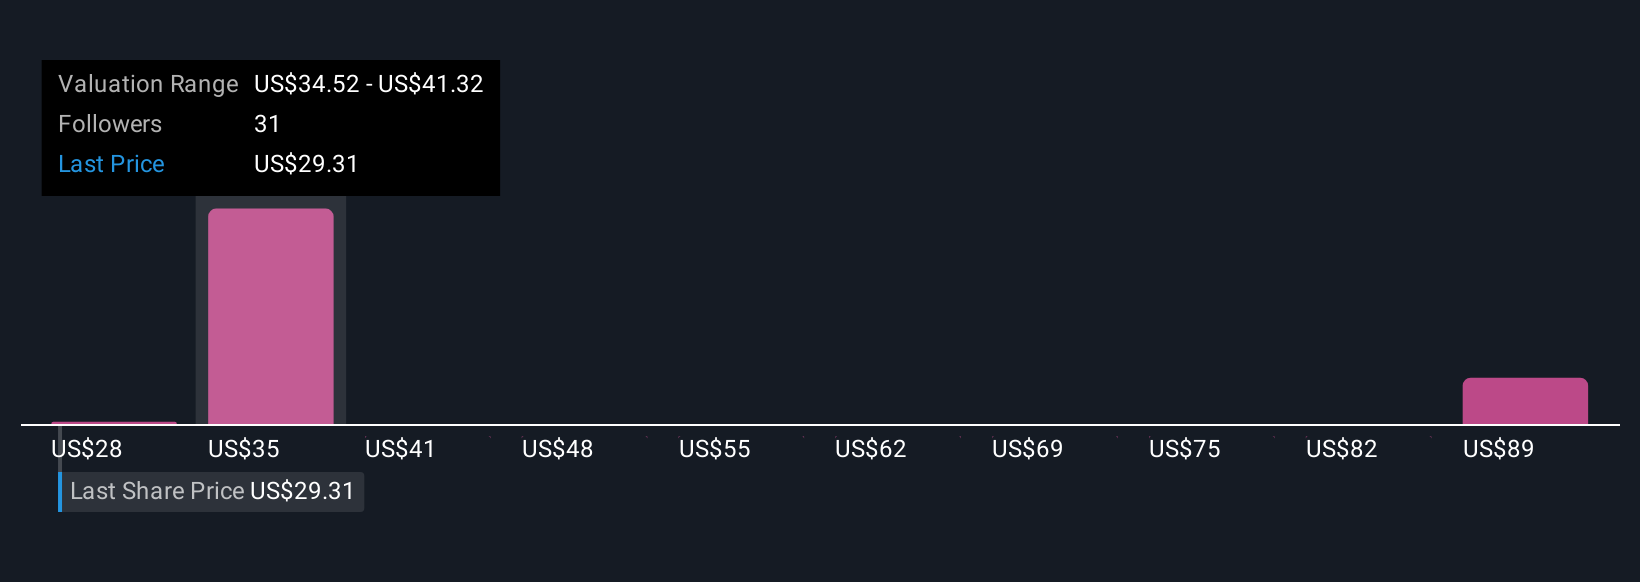
Take Clearway Energy for example. Some investors believe rapid renewable energy adoption and robust contract pipelines justify a fair value as high as $40 per share. Others, weighing risks like policy changes or margin pressures, are more conservative, with fair values closer to $34. Narratives make it easy to see and compare these viewpoints, helping you act confidently based on your unique perspective.
Do you think there's more to the story for Clearway Energy? Create your own Narrative to let the Community know!
This article by Simply Wall St is general in nature. We provide commentary based on historical data and analyst forecasts only using an unbiased methodology and our articles are not intended to be financial advice. It does not constitute a recommendation to buy or sell any stock, and does not take account of your objectives, or your financial situation. We aim to bring you long-term focused analysis driven by fundamental data. Note that our analysis may not factor in the latest price-sensitive company announcements or qualitative material. Simply Wall St has no position in any stocks mentioned.
Mobile Infrastructure for Defense and Disaster
The next wave in robotics isn't humanoid. Its fully autonomous towers delivering 5G, ISR, and radar in under 30 minutes, anywhere.
Get the investor briefing before the next round of contracts
Sponsored On Behalf of CiTechNew: AI Stock Screener & Alerts
Our new AI Stock Screener scans the market every day to uncover opportunities.
• Dividend Powerhouses (3%+ Yield)
• Undervalued Small Caps with Insider Buying
• High growth Tech and AI Companies
Or build your own from over 50 metrics.
Have feedback on this article? Concerned about the content? Get in touch with us directly. Alternatively, email editorial-team@simplywallst.com
About NYSE:CWEN.A
Clearway Energy
Operates in the clean energy generation assets business in the United States.
Established dividend payer and good value.
Similar Companies
Market Insights

Weekly Picks

THE KINGDOM OF BROWN GOODS: WHY MGPI IS BEING CRUSHED BY INVENTORY & PRIMED FOR RESURRECTION


Why Vertical Aerospace (NYSE: EVTL) is Worth Possibly Over 13x its Current Price


The Quiet Giant That Became AI’s Power Grid
Recently Updated Narratives

Butler National (Buks) outperforms.


A tech powerhouse quietly powering the world’s AI infrastructure.


Keppel DC REIT (SGX: AJBU) is a resilient gem in the data center space.
Popular Narratives

MicroVision will explode future revenue by 380.37% with a vision towards success


Crazy Undervalued 42 Baggers Silver Play (Active & Running Mine)


