

The external fund manager backed by Berkshire Hathaway's Charlie Munger, Li Lu, makes no bones about it when he says 'The biggest investment risk is not the volatility of prices, but whether you will suffer a permanent loss of capital.' When we think about how risky a company is, we always like to look at its use of debt, since debt overload can lead to ruin. We can see that Lyft, Inc. (NASDAQ:LYFT) does use debt in its business. But the more important question is: how much risk is that debt creating?
When Is Debt A Problem?
Debt and other liabilities become risky for a business when it cannot easily fulfill those obligations, either with free cash flow or by raising capital at an attractive price. In the worst case scenario, a company can go bankrupt if it cannot pay its creditors. However, a more common (but still painful) scenario is that it has to raise new equity capital at a low price, thus permanently diluting shareholders. Of course, the upside of debt is that it often represents cheap capital, especially when it replaces dilution in a company with the ability to reinvest at high rates of return. The first step when considering a company's debt levels is to consider its cash and debt together.
Check out our latest analysis for Lyft
What Is Lyft's Debt?
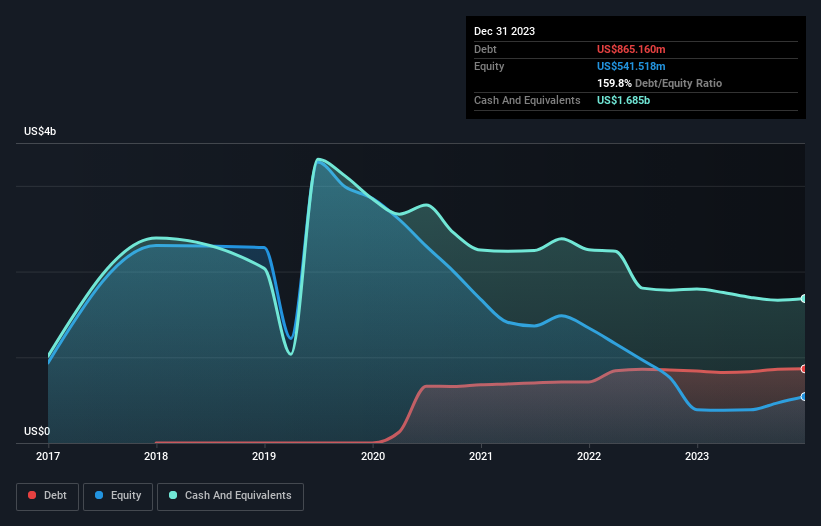
The chart below, which you can click on for greater detail, shows that Lyft had US$865.2m in debt in December 2023; about the same as the year before. However, its balance sheet shows it holds US$1.69b in cash, so it actually has US$820.0m net cash.
A Look At Lyft's Liabilities
The latest balance sheet data shows that Lyft had liabilities of US$2.96b due within a year, and liabilities of US$1.06b falling due after that. On the other hand, it had cash of US$1.69b and US$305.2m worth of receivables due within a year. So its liabilities outweigh the sum of its cash and (near-term) receivables by US$2.03b.
Lyft has a market capitalization of US$7.32b, so it could very likely raise cash to ameliorate its balance sheet, if the need arose. But we definitely want to keep our eyes open to indications that its debt is bringing too much risk. While it does have liabilities worth noting, Lyft also has more cash than debt, so we're pretty confident it can manage its debt safely. There's no doubt that we learn most about debt from the balance sheet. But it is future earnings, more than anything, that will determine Lyft's ability to maintain a healthy balance sheet going forward. So if you're focused on the future you can check out this free report showing analyst profit forecasts.
Over 12 months, Lyft reported revenue of US$4.4b, which is a gain of 7.5%, although it did not report any earnings before interest and tax. That rate of growth is a bit slow for our taste, but it takes all types to make a world.
So How Risky Is Lyft?
Statistically speaking companies that lose money are riskier than those that make money. And the fact is that over the last twelve months Lyft lost money at the earnings before interest and tax (EBIT) line. Indeed, in that time it burnt through US$248m of cash and made a loss of US$340m. But the saving grace is the US$820.0m on the balance sheet. That means it could keep spending at its current rate for more than two years. Overall, we'd say the stock is a bit risky, and we're usually very cautious until we see positive free cash flow. The balance sheet is clearly the area to focus on when you are analysing debt. However, not all investment risk resides within the balance sheet - far from it. For example, we've discovered 3 warning signs for Lyft that you should be aware of before investing here.
If, after all that, you're more interested in a fast growing company with a rock-solid balance sheet, then check out our list of net cash growth stocks without delay.
If you're looking to trade Lyft, open an account with the lowest-cost platform trusted by professionals, Interactive Brokers.
With clients in over 200 countries and territories, and access to 160 markets, IBKR lets you trade stocks, options, futures, forex, bonds and funds from a single integrated account.
Enjoy no hidden fees, no account minimums, and FX conversion rates as low as 0.03%, far better than what most brokers offer.
Sponsored ContentNew: AI Stock Screener & Alerts
Our new AI Stock Screener scans the market every day to uncover opportunities.
• Dividend Powerhouses (3%+ Yield)
• Undervalued Small Caps with Insider Buying
• High growth Tech and AI Companies
Or build your own from over 50 metrics.
Have feedback on this article? Concerned about the content? Get in touch with us directly. Alternatively, email editorial-team (at) simplywallst.com.
This article by Simply Wall St is general in nature. We provide commentary based on historical data and analyst forecasts only using an unbiased methodology and our articles are not intended to be financial advice. It does not constitute a recommendation to buy or sell any stock, and does not take account of your objectives, or your financial situation. We aim to bring you long-term focused analysis driven by fundamental data. Note that our analysis may not factor in the latest price-sensitive company announcements or qualitative material. Simply Wall St has no position in any stocks mentioned.
About NasdaqGS:LYFT
Lyft
Operates a peer-to-peer marketplace for on-demand ridesharing in the United States and Canada.
Undervalued with reasonable growth potential.
Similar Companies
Market Insights

Community Narratives
