- United States
- /
- Marine and Shipping
- /
- NasdaqCM:CTRM
The three-year shareholder returns and company earnings persist lower as Castor Maritime (NASDAQ:CTRM) stock falls a further 18% in past week
It's not possible to invest over long periods without making some bad investments. But you have a problem if you face massive losses more than once in a while. So spare a thought for the long term shareholders of Castor Maritime Inc. (NASDAQ:CTRM); the share price is down a whopping 92% in the last three years. That might cause some serious doubts about the merits of the initial decision to buy the stock, to put it mildly. And more recent buyers are having a tough time too, with a drop of 71% in the last year. Furthermore, it's down 56% in about a quarter. That's not much fun for holders. This could be related to the recent financial results - you can catch up on the most recent data by reading our company report. While a drop like that is definitely a body blow, money isn't as important as health and happiness.
After losing 18% this past week, it's worth investigating the company's fundamentals to see what we can infer from past performance.
View our latest analysis for Castor Maritime
While the efficient markets hypothesis continues to be taught by some, it has been proven that markets are over-reactive dynamic systems, and investors are not always rational. By comparing earnings per share (EPS) and share price changes over time, we can get a feel for how investor attitudes to a company have morphed over time.
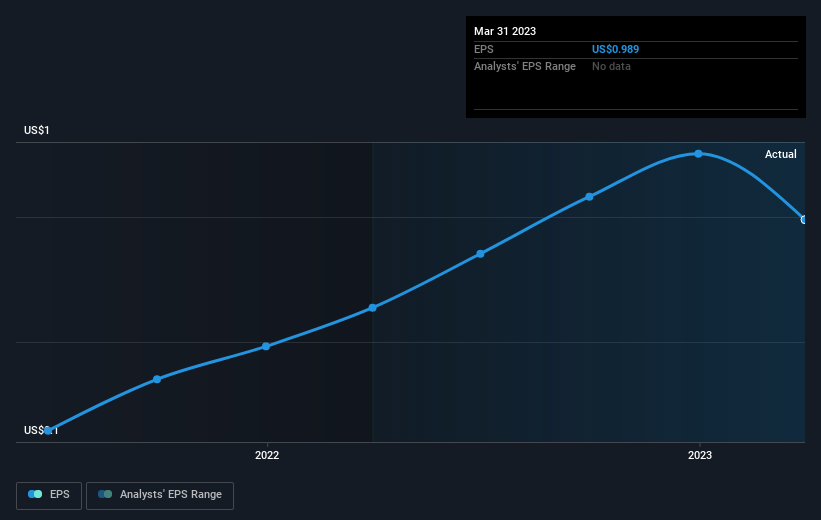
Castor Maritime saw its EPS decline at a compound rate of 16% per year, over the last three years. This reduction in EPS is slower than the 56% annual reduction in the share price. So it's likely that the EPS decline has disappointed the market, leaving investors hesitant to buy. The less favorable sentiment is reflected in its current P/E ratio of 0.56.
You can see how EPS has changed over time in the image below (click on the chart to see the exact values).

This free interactive report on Castor Maritime's earnings, revenue and cash flow is a great place to start, if you want to investigate the stock further.
What About The Total Shareholder Return (TSR)?
We've already covered Castor Maritime's share price action, but we should also mention its total shareholder return (TSR). The TSR is a return calculation that accounts for the value of cash dividends (assuming that any dividend received was reinvested) and the calculated value of any discounted capital raisings and spin-offs. Castor Maritime hasn't been paying dividends, but its TSR of -87% exceeds its share price return of -92%, implying it has either spun-off a business, or raised capital at a discount; thereby providing additional value to shareholders.
A Different Perspective
Over the last year, Castor Maritime shareholders took a loss of 57%. In contrast the market gained about 1.7%. Of course the long term matters more than the short term, and even great stocks will sometimes have a poor year. The three-year loss of 23% per year isn't as bad as the last twelve months, suggesting that the company has not been able to convince the market it has solved its problems. Although Baron Rothschild famously said to "buy when there's blood in the streets, even if the blood is your own", he also focusses on high quality stocks with solid prospects. It's always interesting to track share price performance over the longer term. But to understand Castor Maritime better, we need to consider many other factors. Even so, be aware that Castor Maritime is showing 2 warning signs in our investment analysis , you should know about...
We will like Castor Maritime better if we see some big insider buys. While we wait, check out this free list of growing companies with considerable, recent, insider buying.
Please note, the market returns quoted in this article reflect the market weighted average returns of stocks that currently trade on American exchanges.
New: AI Stock Screener & Alerts
Our new AI Stock Screener scans the market every day to uncover opportunities.
• Dividend Powerhouses (3%+ Yield)
• Undervalued Small Caps with Insider Buying
• High growth Tech and AI Companies
Or build your own from over 50 metrics.
Have feedback on this article? Concerned about the content? Get in touch with us directly. Alternatively, email editorial-team (at) simplywallst.com.
This article by Simply Wall St is general in nature. We provide commentary based on historical data and analyst forecasts only using an unbiased methodology and our articles are not intended to be financial advice. It does not constitute a recommendation to buy or sell any stock, and does not take account of your objectives, or your financial situation. We aim to bring you long-term focused analysis driven by fundamental data. Note that our analysis may not factor in the latest price-sensitive company announcements or qualitative material. Simply Wall St has no position in any stocks mentioned.
About NasdaqCM:CTRM
Excellent balance sheet and slightly overvalued.
Market Insights
Community Narratives


