- United States
- /
- Wireless Telecom
- /
- NasdaqGS:TMUS
Is T-Mobile US Now An Opportunity After Recent Share Price Pullback?

Reviewed by Bailey Pemberton
- Wondering if T-Mobile US at around $195 a share is starting to look like a deal, or if the market still has it about right? You are not alone, as plenty of investors are asking the same thing.
- The stock has slid recently, with returns of around -6.9% over the last week, -8.2% over the last month, and -11.1% year to date. However, the 3-year and 5-year returns of 41.9% and 53.1% still point to a longer-term success story.
- Part of that pullback reflects shifting sentiment across telecoms as investors weigh competitive dynamics and capital spending needs. At the same time, T-Mobile continues to press its advantage in 5G coverage and customer growth. Headlines around network investments, promotional battles with rivals, and ongoing share repurchases are also shaping how the market prices the stock today.
- On our numbers, T-Mobile US scores a 4/6 valuation score, suggesting it looks undervalued on several key metrics but not across the board. Next we will break down what different valuation models are saying, while keeping an eye on an even better way to think about value that we will come back to at the end.
Find out why T-Mobile US's -14.5% return over the last year is lagging behind its peers.
Approach 1: T-Mobile US Discounted Cash Flow (DCF) Analysis
A Discounted Cash Flow, or DCF, model estimates what a business is worth today by projecting the cash it can generate in the future and discounting those cash flows back to their value in the present.
For T-Mobile US, the model starts with last twelve months Free Cash Flow of about $14.0 billion and uses analyst forecasts for the next few years. It then extrapolates further using a 2 Stage Free Cash Flow to Equity approach. On this basis, Simply Wall St projects Free Cash Flow rising to roughly $29.5 billion by 2035, with interim years gradually stepping up from the high teens to mid 20s billions of dollars as the business scales.
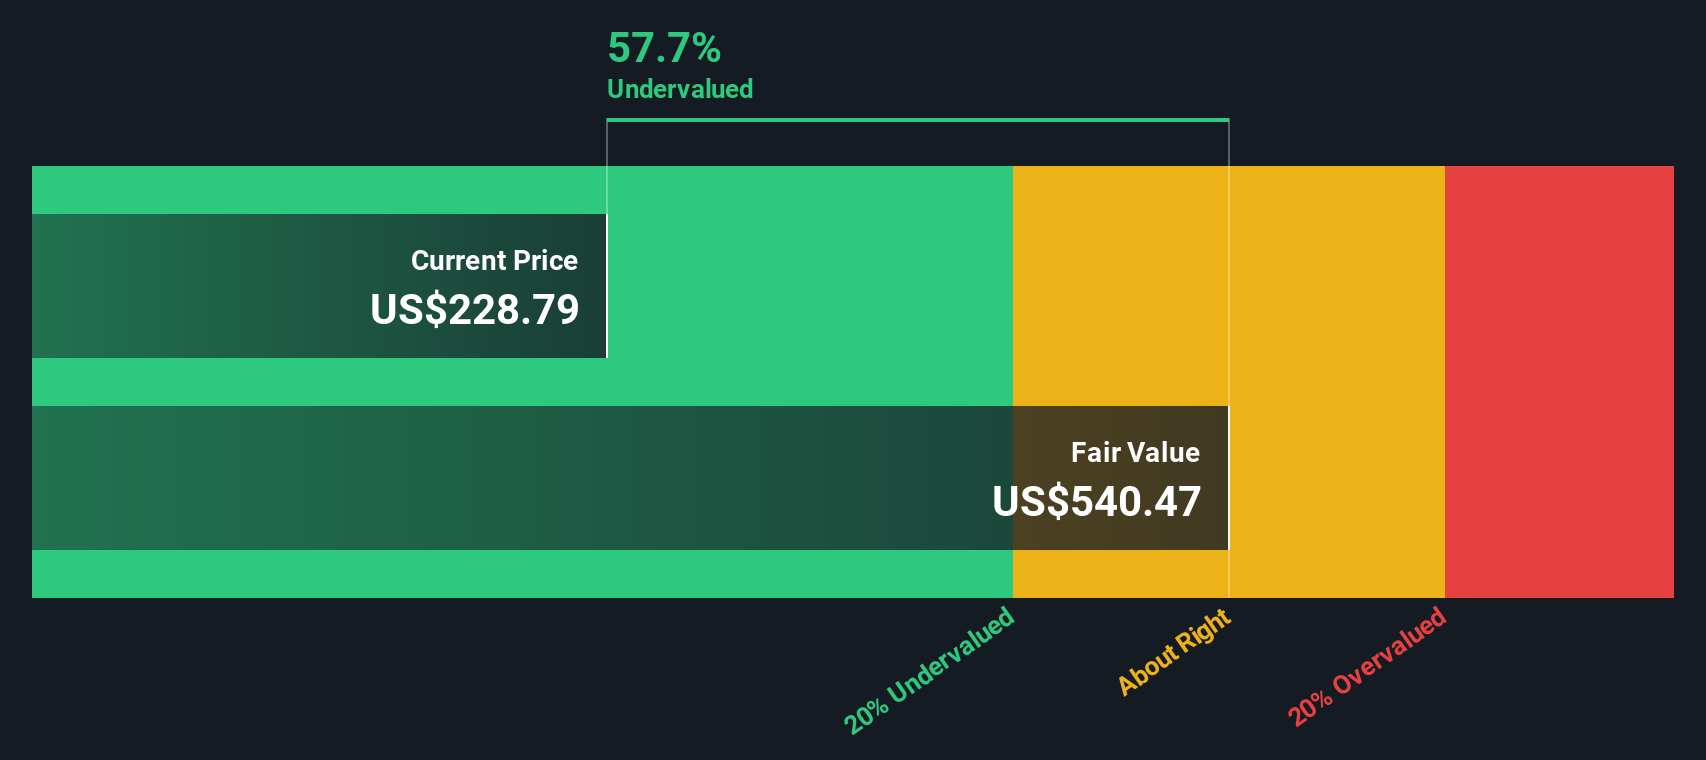
When all those future cash flows are discounted back, the intrinsic value comes out at about $529 per share. Compared with the current share price around $195, the DCF implies the stock is roughly 63.1% undervalued. This indicates a substantial margin of safety if these projections prove accurate.
Result: UNDERVALUED
Our Discounted Cash Flow (DCF) analysis suggests T-Mobile US is undervalued by 63.1%. Track this in your watchlist or portfolio, or discover 903 more undervalued stocks based on cash flows.
Approach 2: T-Mobile US Price vs Earnings
For profitable businesses like T-Mobile US, the price to earnings multiple is a useful way to gauge value because it links what you pay directly to the profits the company is generating today. In general, faster growing and less risky companies can justify a higher PE ratio, while slower growth or higher uncertainty usually means a lower, more conservative multiple is appropriate.
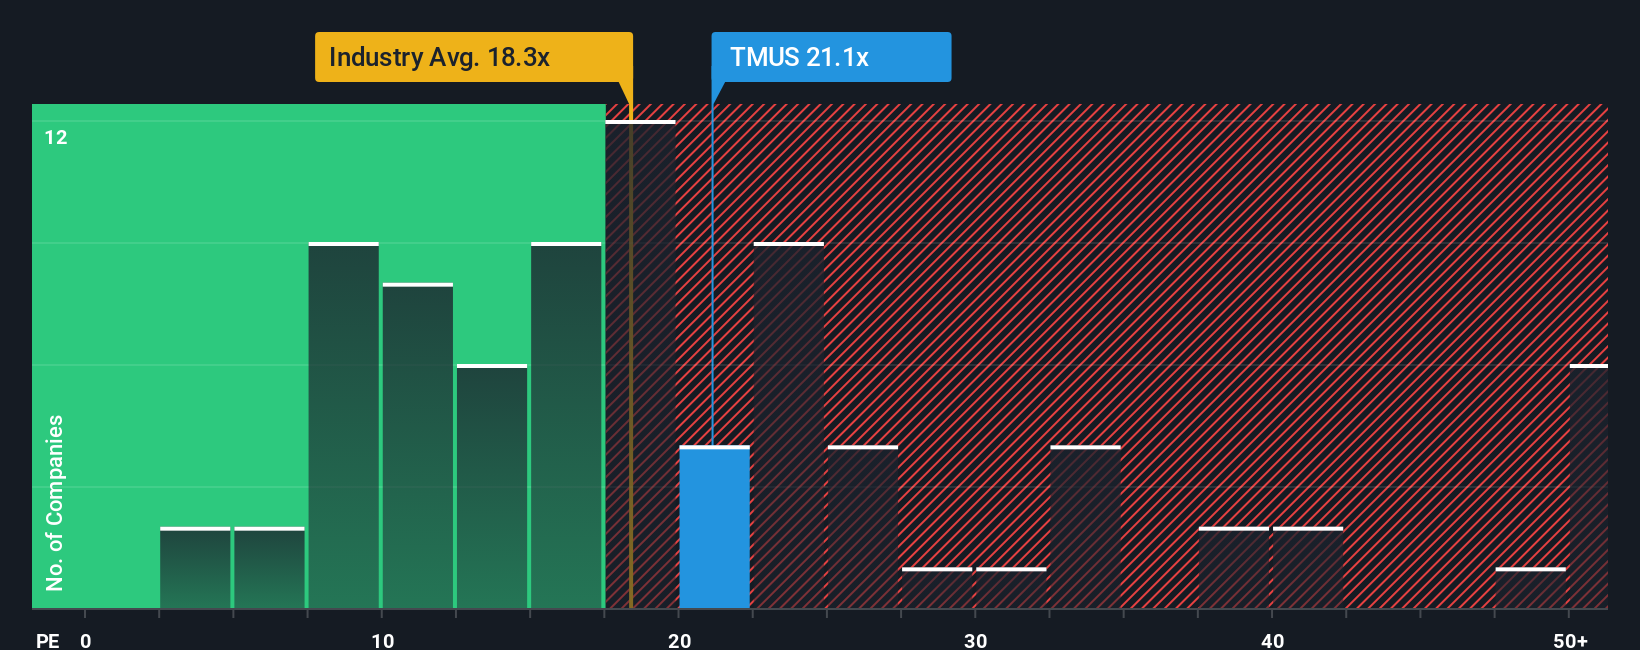
T-Mobile US currently trades on a PE of about 18.4x. That is slightly above the Wireless Telecom industry average of roughly 17.7x, but well below the broader peer group average of around 34.1x. This suggests the market is not pricing it as aggressively as many comparable stocks. Simply Wall St also calculates a Fair Ratio of 16.6x, which is the PE you might expect given T-Mobile US earnings growth outlook, profit margins, industry positioning, market cap and specific risk profile.
This Fair Ratio is more informative than a simple comparison with industry or peers because it adjusts for the company specific drivers that should influence what investors are willing to pay for each dollar of earnings. With the current PE of 18.4x sitting modestly above the 16.6x Fair Ratio, the shares look slightly expensive on this measure.
Result: OVERVALUED
PE ratios tell one story, but what if the real opportunity lies elsewhere? Discover 1442 companies where insiders are betting big on explosive growth.
Upgrade Your Decision Making: Choose your T-Mobile US Narrative
Earlier we mentioned that there is an even better way to understand valuation, so let us introduce you to Narratives, a simple way to turn your view of a company into a story that connects assumptions about future revenue, earnings and margins to a clear fair value estimate you can compare with today’s share price.
A Narrative on Simply Wall St is your structured perspective on a business, hosted within the Community page that millions of investors use, where you spell out what you think will drive T-Mobile US growth, how its margins may evolve, and what that implies for future cash flows and a fair value range.
Because Narratives are tied directly to a live forecast model, they are designed to help you decide how to act by showing whether your fair value is above or below the current market price, and they automatically update when fresh news, guidance or earnings data changes the inputs behind the story.
For example, one T-Mobile US Narrative might lean bullish, assuming sustained 5G leadership, rising margins toward about 17 to 18 percent and a fair value in the higher $200s or lower $300s. A more cautious Narrative could focus on tariff risks, competitive promotions and upfront fiber costs, anchoring fair value nearer $200 and treating recent prices as fully valued or even rich.
Do you think there's more to the story for T-Mobile US? Head over to our Community to see what others are saying!

This article by Simply Wall St is general in nature. We provide commentary based on historical data and analyst forecasts only using an unbiased methodology and our articles are not intended to be financial advice. It does not constitute a recommendation to buy or sell any stock, and does not take account of your objectives, or your financial situation. We aim to bring you long-term focused analysis driven by fundamental data. Note that our analysis may not factor in the latest price-sensitive company announcements or qualitative material. Simply Wall St has no position in any stocks mentioned.
Mobile Infrastructure for Defense and Disaster
The next wave in robotics isn't humanoid. Its fully autonomous towers delivering 5G, ISR, and radar in under 30 minutes, anywhere.
Get the investor briefing before the next round of contracts
Sponsored On Behalf of CiTechValuation is complex, but we're here to simplify it.
Discover if T-Mobile US might be undervalued or overvalued with our detailed analysis, featuring fair value estimates, potential risks, dividends, insider trades, and its financial condition.
Access Free AnalysisHave feedback on this article? Concerned about the content? Get in touch with us directly. Alternatively, email editorial-team@simplywallst.com
About NasdaqGS:TMUS
T-Mobile US
Provides wireless communications services in the United States, Puerto Rico, and the United States Virgin Islands.
Good value with acceptable track record.
Similar Companies
Market Insights

Weekly Picks

THE KINGDOM OF BROWN GOODS: WHY MGPI IS BEING CRUSHED BY INVENTORY & PRIMED FOR RESURRECTION


Why Vertical Aerospace (NYSE: EVTL) is Worth Possibly Over 13x its Current Price


The Quiet Giant That Became AI’s Power Grid
Recently Updated Narratives

Butler National (Buks) outperforms.


A tech powerhouse quietly powering the world’s AI infrastructure.


Keppel DC REIT (SGX: AJBU) is a resilient gem in the data center space.
Popular Narratives

MicroVision will explode future revenue by 380.37% with a vision towards success


Crazy Undervalued 42 Baggers Silver Play (Active & Running Mine)


