Advertisement
- United States
- /
- Software
- /
- NYSE:FIG
Should You Rethink Figma After Its 15% Rally and AI Expansion Announcement?

Simply Wall St
Reviewed by Bailey Pemberton
Wondering what to make of Figma’s stock right now? You’re not alone. After a tough start to the year, Figma’s price has reversed dramatically, jumping 15.1% in the past week and 19.6% over the last month. These eye-catching moves come as investors rethink risk across the software sector. Sentiment has shifted, and with it, Figma’s prospects in the eyes of many. The company, known for its collaborative design platform, remains a focal point for growth-focused investors eager to catch the next wave of digital transformation.
But are these price jumps telling the full story? Digging a little deeper, Figma currently lands a value score of 0 out of 6 checks for undervaluation. That means, by classic metrics, it isn’t underpriced in any of the ways most value investors look for. It sets up a fascinating debate: can recent momentum alone justify buying in, or is the stock already ahead of itself?
To answer that, we’ll break down the main valuation approaches and see how Figma stacks up. Stick around through the end, as there’s an even more insightful angle on valuing Figma that goes beyond just the numbers.
Figma scores just 0/6 on our valuation checks. See what other red flags we found in the full valuation breakdown.
Approach 1: Figma Discounted Cash Flow (DCF) Analysis
The Discounted Cash Flow (DCF) model estimates a company’s intrinsic value by forecasting future cash flows and then discounting those amounts back to today using a required rate of return. This approach attempts to determine what Figma is truly worth based on how much cash it can generate for shareholders over time.
For Figma, the current Free Cash Flow stands at $294.3 million. Analysts provide projections for the next five years, and beyond that, cash flows are extrapolated using growth assumptions. For example, by 2029, Free Cash Flow is expected to reach $367.5 million, and in 2035, the extrapolated estimate climbs to $638.7 million. All figures are in US dollars and remain well below the billion-dollar mark, reflecting a steady, but not explosive, growth outlook.
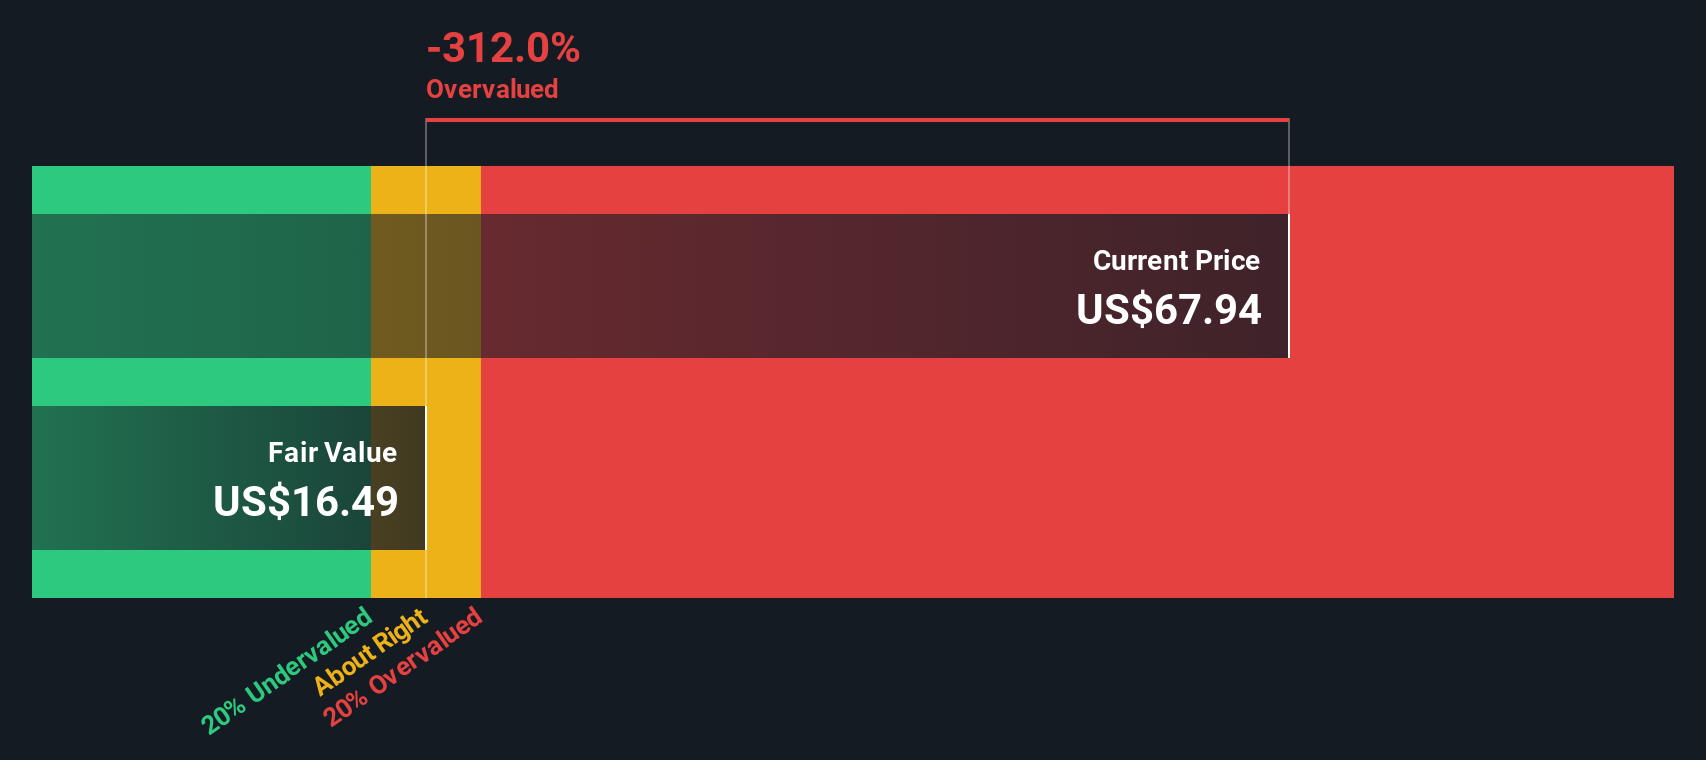
After discounting each future year's cash flow to the present, the DCF model calculates Figma’s intrinsic value at $16.49 per share. Compared to the current share price, this indicates Figma is trading at a substantial 270.3% premium, making the stock significantly overvalued by this approach.
Result: OVERVALUED
Our Discounted Cash Flow (DCF) analysis suggests Figma may be overvalued by 270.3%. Find undervalued stocks or create your own screener to find better value opportunities.
Approach 2: Figma Price vs Sales
The Price-to-Sales (P/S) ratio is an especially relevant metric for evaluating rapidly growing software companies like Figma, where profits may not fully reflect the business's underlying potential. The P/S ratio focuses on revenue and sidesteps accounting choices that can obscure true operating momentum. It is widely used for high-growth firms investing heavily in future expansion.
Growth expectations and perceived risks both play a role in what investors consider a “normal” or “fair” P/S ratio. Generally, higher growth businesses are rewarded with higher P/S ratios. Companies facing greater uncertainty or weaker outlooks tend to trade at a discount to industry norms.
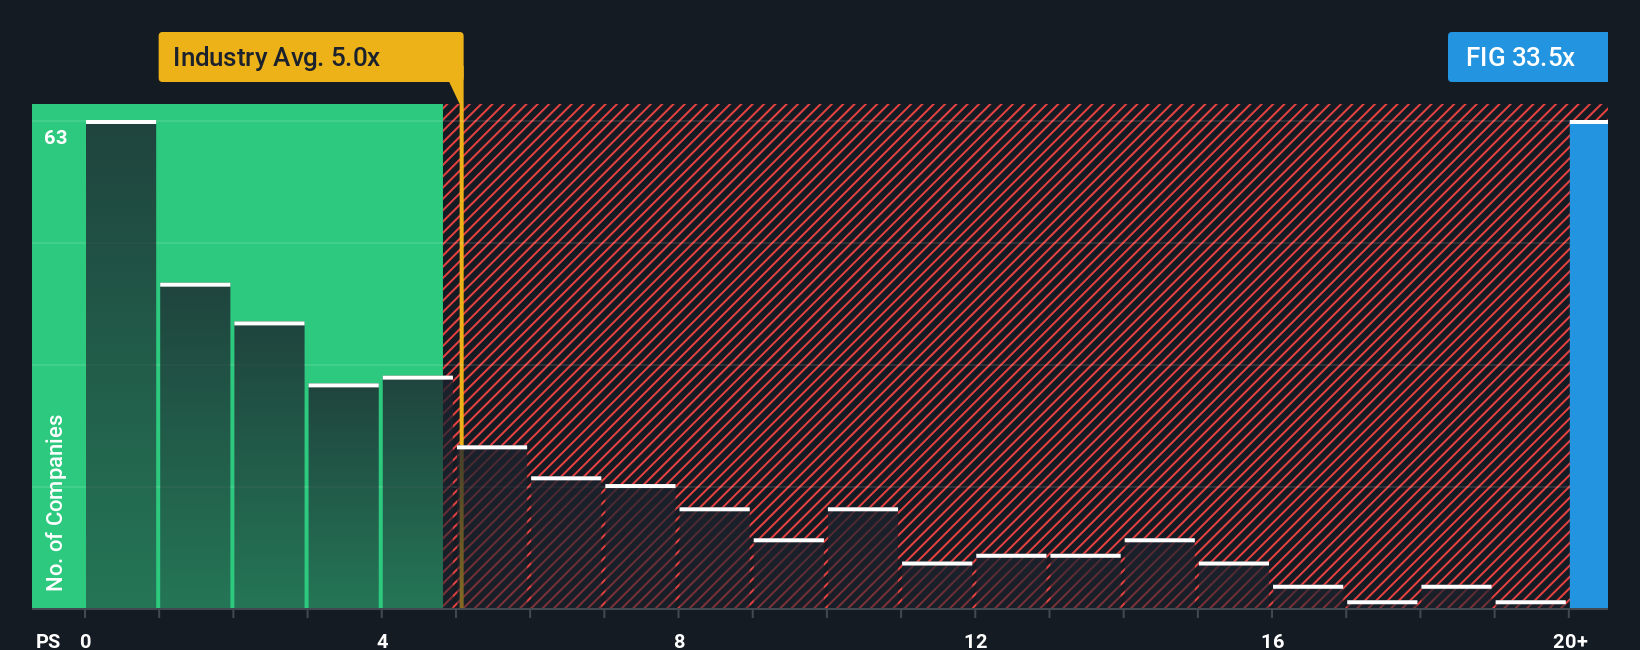
As of now, Figma trades at a P/S ratio of 33.47x. That compares to an industry average of 5.18x and a peer group average of 9.39x. While this places Figma well above both benchmarks, it is important to look beyond simple comparisons. Simply Wall St’s Fair Ratio takes a more nuanced approach by adjusting for the company’s earnings growth, profit margins, risk profile, industry characteristics, and market cap. This helps investors judge whether a high multiple is justified by fundamentals rather than just market hype.
By comparing Figma’s P/S ratio to its Fair Ratio, we can assess whether the stock’s premium valuation is justified. In this case, Figma’s current P/S is dramatically higher than both its peer and industry averages and also significantly above its Fair Ratio. This suggests that it is trading at levels not supported by core fundamentals or outlook.
Result: OVERVALUED
PS ratios tell one story, but what if the real opportunity lies elsewhere? Discover companies where insiders are betting big on explosive growth.
Upgrade Your Decision Making: Choose your Figma Narrative
Earlier we mentioned that there’s an even better way to understand valuation, so let's introduce you to Narratives. A Narrative is simply your point of view about a company, combining the story you believe about its future with the numbers that support it. These include your assumptions for revenue, earnings, margins, and ultimately what you think is a fair value. Narratives connect the dots from company story to financial forecast and then directly to what the stock should be worth today.
On Simply Wall St’s Community page, Narratives are a powerful yet easy tool used by millions of investors. They help you see whether your story about Figma justifies buying or selling, by directly comparing the current market price with your calculated Fair Value. When news, earnings, or surprises hit, Narratives update dynamically so your view of Figma is always current.
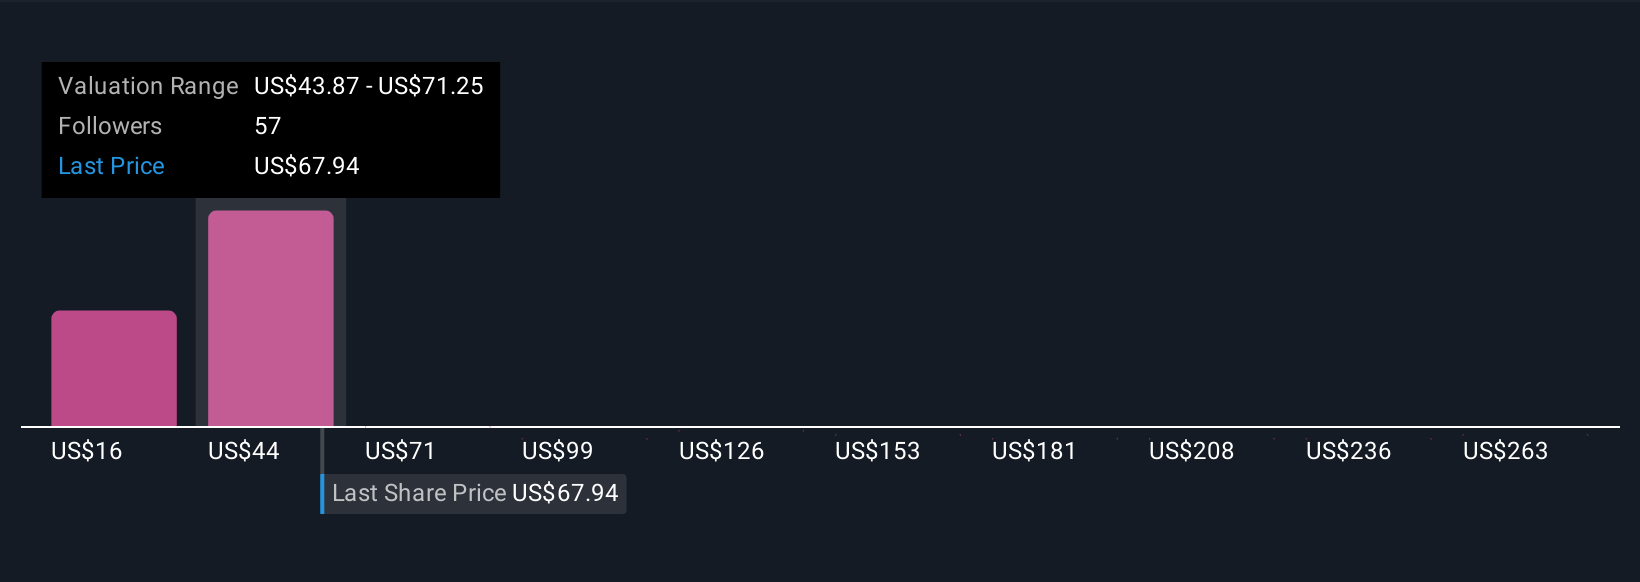
For example, with Figma trading on NYSE:FIG, one investor’s Narrative might estimate a fair value of just $42 if they’re cautious about competition and growth, while another’s more optimistic view could be as high as $85. This reflects belief in Figma dominating creative software through its expanding AI-powered platform.
Do you think there's more to the story for Figma? Create your own Narrative to let the Community know!
This article by Simply Wall St is general in nature. We provide commentary based on historical data and analyst forecasts only using an unbiased methodology and our articles are not intended to be financial advice. It does not constitute a recommendation to buy or sell any stock, and does not take account of your objectives, or your financial situation. We aim to bring you long-term focused analysis driven by fundamental data. Note that our analysis may not factor in the latest price-sensitive company announcements or qualitative material. Simply Wall St has no position in any stocks mentioned.
New: AI Stock Screener & Alerts
Our new AI Stock Screener scans the market every day to uncover opportunities.
• Dividend Powerhouses (3%+ Yield)
• Undervalued Small Caps with Insider Buying
• High growth Tech and AI Companies
Or build your own from over 50 metrics.
Have feedback on this article? Concerned about the content? Get in touch with us directly. Alternatively, email editorial-team@simplywallst.com
About NYSE:FIG
Figma
Develops a browser-based tool for designing user interfaces that helps design and development teams build various products.
Flawless balance sheet with slight risk.
Similar Companies
Market Insights

Advertisement
Community Narratives
A formidable player in AI and enterprise computing.
Fair Value US$210.00|12.2% overvalued
CO
Community Contributor
IREN's Bold Moves in Sustainable Bitcoin Mining & AI Data Centers
Fair Value US$72.52|17.1% undervalued
BL
Community Contributor
Cooling the Champions: The Aussie Tech Behind F1's Victories
Fair Value AU$12.40|38.7% undervalued
TR
Community Contributor