Advertisement
- United States
- /
- Software
- /
- NasdaqGS:ROP
Is There an Opportunity in Roper Technologies After Recent Earnings Beat?

Simply Wall St
Reviewed by Bailey Pemberton
If you're weighing whether Roper Technologies deserves a spot in your portfolio, you’re definitely not alone. The stock’s journey over the last year has given investors a lot to talk about, with the share price closing recently at $513.82. Short-term watchers might notice a mild uptick of 0.6% over the past week and a 0.3% gain for the month, but longer-term holders have seen much bigger swings. Over the past year, the share price has dipped by 7.0%. A wider lens shows 39.3% growth over three years and a solid 25.0% over a five-year stretch. Those numbers reflect a mix of factors, including investor sentiment shifting on market developments and the company’s place in a changing tech-driven landscape.
What’s especially interesting right now is Roper’s valuation profile. Using a set of six standard checks for undervaluation, the company notched a score of 4. That means it is looking undervalued in four out of six key areas, which is a compelling foundation for further research. Before making a decision based solely on numbers, it is important to examine these valuation methods one by one, and stay tuned for a look at an even more insightful way to understand what Roper is really worth.
Why Roper Technologies is lagging behind its peers
Approach 1: Roper Technologies Discounted Cash Flow (DCF) Analysis
The Discounted Cash Flow (DCF) model estimates a company’s worth by projecting its future cash flows and discounting them back to today’s value. For Roper Technologies, this approach uses projected Free Cash Flow (FCF) figures over the next several years to capture the company’s earning potential.
Currently, Roper Technologies generates about $2.29 billion in Free Cash Flow per year. Analyst estimates expect steady FCF growth, reaching approximately $3.81 billion by 2028. Further projections, extrapolated by Simply Wall St, suggest FCF could climb beyond $5.9 billion in the next decade. These long-range estimates are based more on trend than consensus forecasts.
Based on these calculations, the DCF model assigns Roper Technologies an intrinsic value of $671.31 per share. With the share price recently at $513.82, this implies the stock is trading at a 23.5% discount according to this method.
Result: UNDERVALUED
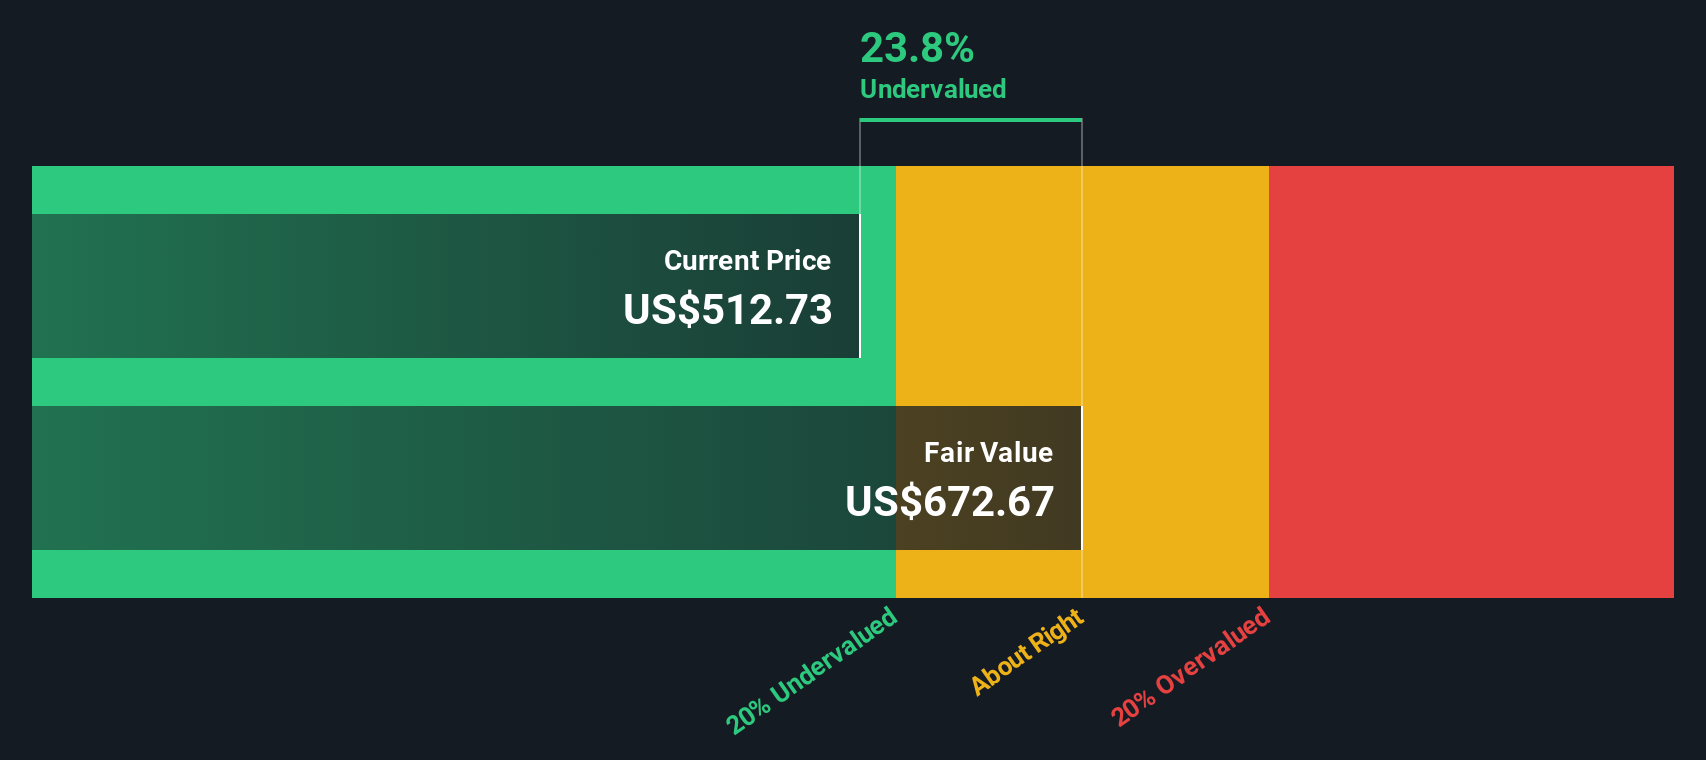
Our Discounted Cash Flow (DCF) analysis suggests Roper Technologies is undervalued by 23.5%. Track this in your watchlist or portfolio, or discover more undervalued stocks.
Approach 2: Roper Technologies Price vs Earnings
For profitable companies like Roper Technologies, the Price-to-Earnings (PE) ratio is a widely accepted way to gauge whether a stock is reasonably valued. This metric compares a company’s current share price to its per-share earnings, making it a useful shorthand for how much investors are willing to pay for a slice of future profits.
It’s important to remember that what counts as a “normal” or “fair” PE ratio depends on several factors. Higher growth expectations often justify a higher PE, while greater risks or weaker profit margins can pull the ratio down. As such, context matters when comparing a company’s PE to industry norms or peers.
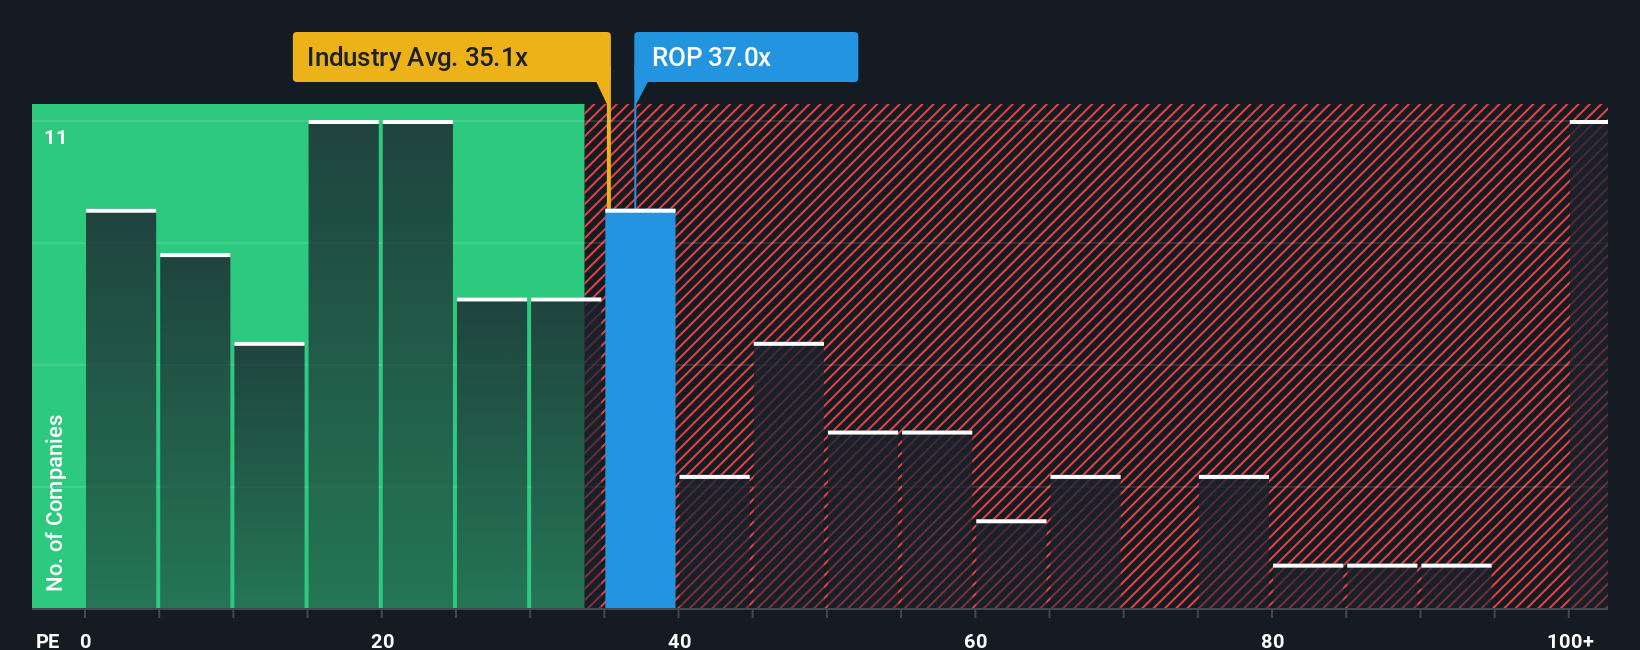
Roper Technologies is trading at a PE of 35.9x, putting it just above the Software industry average of 34.9x but well below the average for its closest peers at 80.4x. Beyond simple averages, the Simply Wall St Fair Ratio for Roper, calculated using elements like earnings growth, market cap, profit margins, and risk profile, sits at 35.8x.
The Fair Ratio approach provides a more tailored way to assess valuation, as it accounts for the company’s unique growth prospects and risk factors rather than just broad sector trends or comparisons with individual peers. This makes it a more reliable benchmark for long-term investors.
With Roper’s actual PE and its Fair Ratio practically identical, the stock appears to be precisely valued by the market according to these underlying fundamentals.
Result: ABOUT RIGHT
PE ratios tell one story, but what if the real opportunity lies elsewhere? Discover companies where insiders are betting big on explosive growth.
Upgrade Your Decision Making: Choose your Roper Technologies Narrative
Earlier, we mentioned there is an even better way to understand valuation, so let’s introduce you to Narratives, a tool that helps you go beyond the numbers and connect your unique perspective on Roper Technologies with a tailored financial forecast and fair value.
A Narrative is simply your personalized investment story, where you outline your beliefs and assumptions about the company’s future revenue, earnings, and margins. This gives you both context and conviction as you analyze where the share price should be today.
This approach bridges the company’s story to real financial forecasts, resulting in a fair value that is easy to compare to the stock’s current price. It is available for anyone to use with just a few clicks on Simply Wall St’s Community page, already trusted by millions of investors.
Because Narratives update automatically when new earnings or news break, you always have a living, current view that reflects the latest developments. This makes it a powerful way to know when to reconsider your position as the facts change.
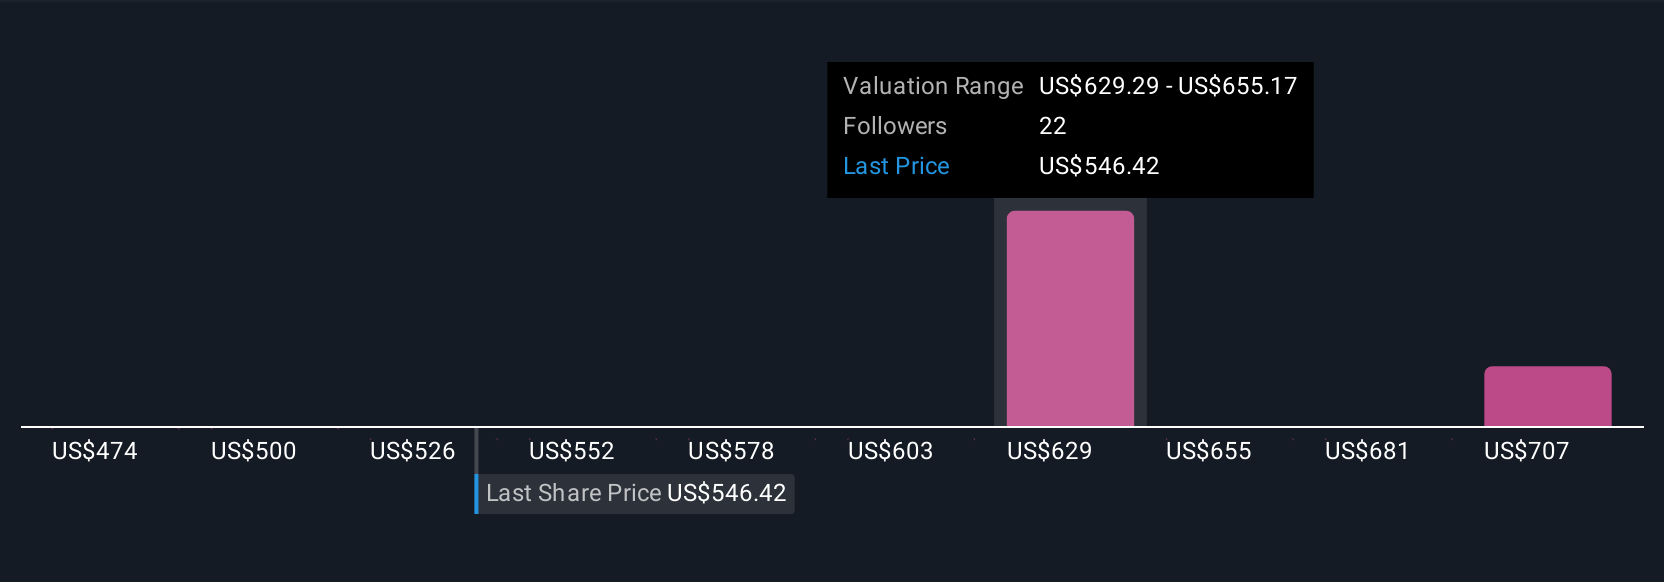
For example, some investors think Roper’s AI-powered SaaS expansion and strong recurring revenues justify a fair value as high as $714 per share, while others, more cautious about integration and competition risks, see fair value closer to $460. This is a perfect illustration of how Narratives capture a dynamic range of informed viewpoints.
Do you think there's more to the story for Roper Technologies? Create your own Narrative to let the Community know!
This article by Simply Wall St is general in nature. We provide commentary based on historical data and analyst forecasts only using an unbiased methodology and our articles are not intended to be financial advice. It does not constitute a recommendation to buy or sell any stock, and does not take account of your objectives, or your financial situation. We aim to bring you long-term focused analysis driven by fundamental data. Note that our analysis may not factor in the latest price-sensitive company announcements or qualitative material. Simply Wall St has no position in any stocks mentioned.
New: AI Stock Screener & Alerts
Our new AI Stock Screener scans the market every day to uncover opportunities.
• Dividend Powerhouses (3%+ Yield)
• Undervalued Small Caps with Insider Buying
• High growth Tech and AI Companies
Or build your own from over 50 metrics.
Have feedback on this article? Concerned about the content? Get in touch with us directly. Alternatively, email editorial-team@simplywallst.com
About NasdaqGS:ROP
Roper Technologies
Designs and develops vertical software and technology enabled products in the United States, Canada, Europe, Asia, and internationally.
Good value with mediocre balance sheet.
Similar Companies
Market Insights

Advertisement
Community Narratives
A formidable player in AI and enterprise computing.
Fair Value US$210.00|3.9% overvalued
CO
Community Contributor
IREN's Bold Moves in Sustainable Bitcoin Mining & AI Data Centers
Fair Value US$89.00|21.8% undervalued
BL
Community Contributor
Cooling the Champions: The Aussie Tech Behind F1's Victories
Fair Value AU$12.40|40.6% undervalued
TR
Community Contributor