Advertisement
- United States
- /
- Software
- /
- NasdaqGM:FIVN
Assessing Five9’s Prospects After Shares Fall 46% in 2025 Amid Cloud Sector Uncertainty

Simply Wall St
Reviewed by Bailey Pemberton
If you’ve followed Five9’s stock over the past several years, you know it’s been quite a ride, and chances are you’re weighing what to do next. The cloud contact center specialist has seen its shares tumble a whopping 85.1% over the last five years, and just in the past month alone, the stock dipped another 16.4%. The year-to-date tally is not much prettier at -46.6%, which definitely reflects a shift in how the market is viewing both Five9’s growth prospects and its risk profile.
Yet, in a market where tech valuations often run hot, Five9 is now scoring a 5 out of 6 on our value checks. This suggests the company is significantly undervalued according to most commonly-used metrics. That is a strong signal for anyone thinking about where the stock sits today compared to its potential upside. The latest moves in the share price come amid broader uncertainty in cloud technology and shifting investor sentiment. These factors often trigger opportunity for shrewd buyers when a company’s core fundamentals are better than what the price suggests.
So, is Five9’s low price just a reflection of temporary pessimism, or does it point to deeper challenges? The only way to know for sure is to dig into the valuation details. Next, we’ll walk through how Five9 measures up across the most important approaches, and later, we’ll introduce a framework for valuation that can give you an even sharper perspective.
Why Five9 is lagging behind its peers
Approach 1: Five9 Discounted Cash Flow (DCF) Analysis
The Discounted Cash Flow (DCF) model estimates a company’s value by forecasting its future free cash flows and then discounting them back to the present using an appropriate rate. This approach aims to capture the intrinsic worth of a business based on the cash it is expected to generate over time.
For Five9, the DCF model starts with the company’s latest reported Free Cash Flow, which stands at $116.6 Million. Analyst estimates project steady growth, with Free Cash Flow expected to reach $190.7 Million by 2026 and $363 Million by 2029. Beyond those years, further projections are extrapolated based on historical and industry trends to simulate continued expansion within the Software sector.
Based on these forecasts, the DCF analysis arrives at an estimated intrinsic value of $67.98 per share. Compared to current market prices, this suggests Five9 is trading at a 68.2% discount, indicating a substantial undervaluation under this model.
Result: UNDERVALUED
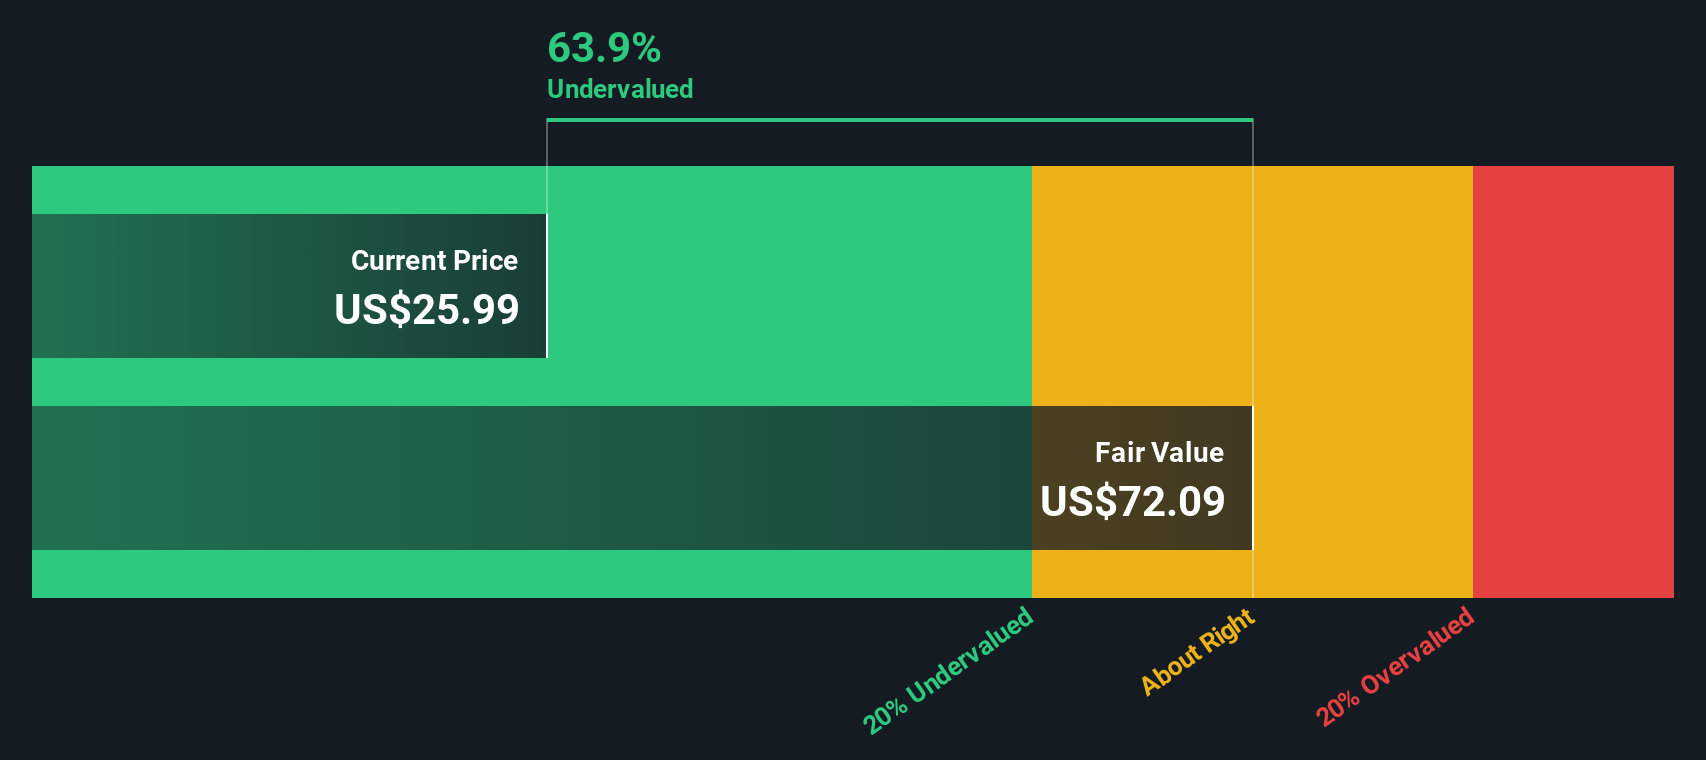
Our Discounted Cash Flow (DCF) analysis suggests Five9 is undervalued by 68.2%. Track this in your watchlist or portfolio, or discover more undervalued stocks.
Approach 2: Five9 Price vs Sales
The Price-to-Sales (P/S) ratio is commonly used to value technology companies like Five9, especially when profitability is variable but revenue growth remains strong. This ratio helps investors assess how much they are paying for each dollar of sales, making it ideal for comparing rapidly evolving businesses where earnings may not be the best indicator of overall potential or risk.
Market expectations for growth and risk also shape what constitutes a "normal" or "fair" P/S ratio. Companies with higher growth prospects or more stable business models often command higher multiples, while those facing uncertainties generally trade at lower ratios to compensate for perceived risk.
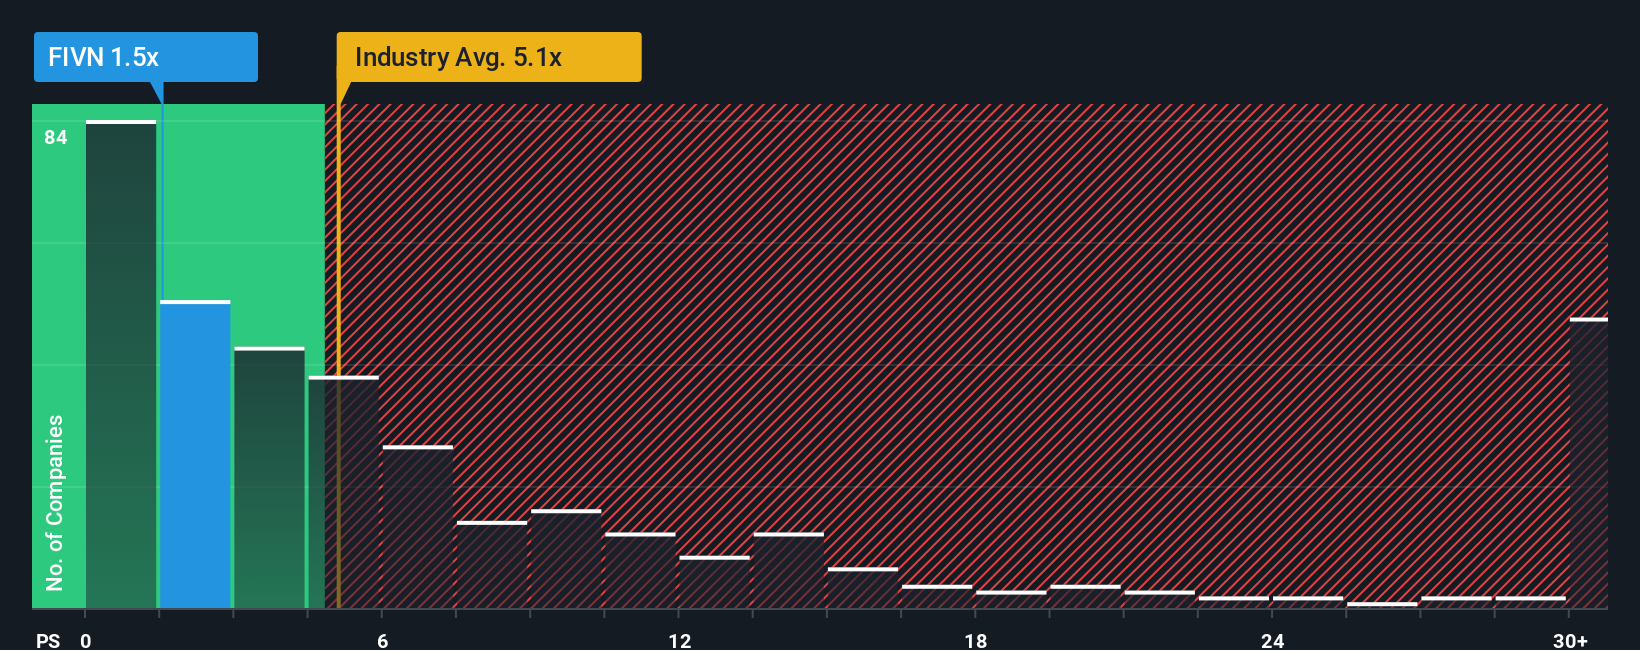
Currently, Five9 is trading at a P/S ratio of 1.51x. This sits well below both the industry average of 5.10x and the peer average of 4.32x, indicating the market is assigning a discount relative to similar companies. However, Simply Wall St’s proprietary “Fair Ratio” for Five9 is 2.78x. The Fair Ratio is a tailored benchmark that adjusts for earnings growth, industry context, profit margins, company size, and risk profile. This offers a more precise reflection of what would be reasonable given Five9's specific circumstances.
Comparing Simply Wall St’s Fair Ratio with Five9’s actual P/S shows that the stock is underappreciated by the market on this metric, trading well below what its fundamentals arguably justify.
Result: UNDERVALUED
PS ratios tell one story, but what if the real opportunity lies elsewhere? Discover companies where insiders are betting big on explosive growth.
Upgrade Your Decision Making: Choose your Five9 Narrative
Earlier we mentioned that there is an even better way to understand valuation, so let us introduce you to Narratives. A Narrative is a simple, accessible tool that lets you connect the story you believe about Five9 with your perspective on where its business is heading, aligning this view with your own expectations for fair value, future growth, and profit margins.
With Narratives, you are not just looking at numbers in isolation. Instead, you tie a real-world business journey to a financial forecast and a fair value, making it much easier to decide when to buy or sell based on whether the current price is above or below your story’s fair value.
Narratives live on the Simply Wall St Community page, which is used by millions of investors, and update automatically as new company news, earnings, or industry events unfold so your assumptions always stay relevant.
For example, some Five9 investors see rapid AI adoption, expanding partnerships, and rising contract values as signs the stock should be worth $59 per share. Others worry about competition and leadership changes, looking for downside to $28. Narratives let you quickly compare how your story stacks up against the wider market.
Do you think there's more to the story for Five9? Create your own Narrative to let the Community know!

This article by Simply Wall St is general in nature. We provide commentary based on historical data and analyst forecasts only using an unbiased methodology and our articles are not intended to be financial advice. It does not constitute a recommendation to buy or sell any stock, and does not take account of your objectives, or your financial situation. We aim to bring you long-term focused analysis driven by fundamental data. Note that our analysis may not factor in the latest price-sensitive company announcements or qualitative material. Simply Wall St has no position in any stocks mentioned.
New: AI Stock Screener & Alerts
Our new AI Stock Screener scans the market every day to uncover opportunities.
• Dividend Powerhouses (3%+ Yield)
• Undervalued Small Caps with Insider Buying
• High growth Tech and AI Companies
Or build your own from over 50 metrics.
Have feedback on this article? Concerned about the content? Get in touch with us directly. Alternatively, email editorial-team@simplywallst.com
About NasdaqGM:FIVN
Five9
Provides intelligent cloud software for contact centers in the United States and internationally.
Flawless balance sheet and undervalued.
Similar Companies
Market Insights

Advertisement
Community Narratives
A formidable player in AI and enterprise computing.
Fair Value US$210.00|3.1% overvalued
CO
Community Contributor
IREN's Bold Moves in Sustainable Bitcoin Mining & AI Data Centers
Fair Value US$72.52|11.6% undervalued
BL
Community Contributor
Cooling the Champions: The Aussie Tech Behind F1's Victories
Fair Value AU$12.40|39.4% undervalued
TR
Community Contributor