Advertisement
- United States
- /
- Software
- /
- NasdaqGS:DOCU
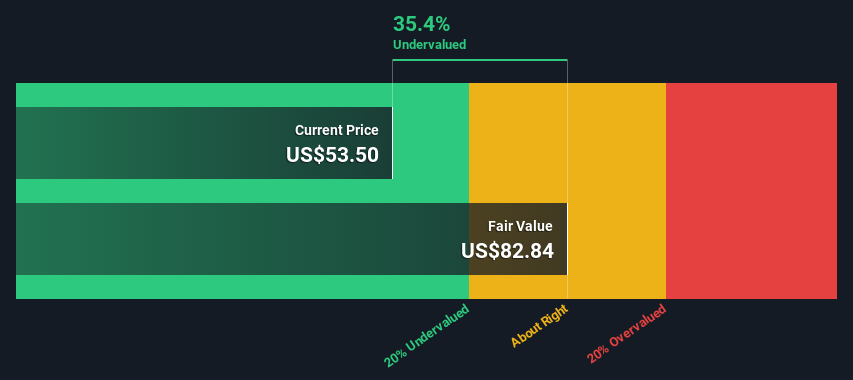
An Intrinsic Calculation For DocuSign, Inc. (NASDAQ:DOCU) Suggests It's 35% Undervalued
Key Insights
- Using the 2 Stage Free Cash Flow to Equity, DocuSign fair value estimate is US$82.84
- DocuSign is estimated to be 35% undervalued based on current share price of US$53.50
- Our fair value estimate is 33% higher than DocuSign's analyst price target of US$62.42
Does the July share price for DocuSign, Inc. (NASDAQ:DOCU) reflect what it's really worth? Today, we will estimate the stock's intrinsic value by taking the expected future cash flows and discounting them to today's value. We will take advantage of the Discounted Cash Flow (DCF) model for this purpose. It may sound complicated, but actually it is quite simple!
We generally believe that a company's value is the present value of all of the cash it will generate in the future. However, a DCF is just one valuation metric among many, and it is not without flaws. For those who are keen learners of equity analysis, the Simply Wall St analysis model here may be something of interest to you.
View our latest analysis for DocuSign
Crunching The Numbers
We're using the 2-stage growth model, which simply means we take in account two stages of company's growth. In the initial period the company may have a higher growth rate and the second stage is usually assumed to have a stable growth rate. In the first stage we need to estimate the cash flows to the business over the next ten years. Where possible we use analyst estimates, but when these aren't available we extrapolate the previous free cash flow (FCF) from the last estimate or reported value. We assume companies with shrinking free cash flow will slow their rate of shrinkage, and that companies with growing free cash flow will see their growth rate slow, over this period. We do this to reflect that growth tends to slow more in the early years than it does in later years.
A DCF is all about the idea that a dollar in the future is less valuable than a dollar today, so we discount the value of these future cash flows to their estimated value in today's dollars:
10-year free cash flow (FCF) estimate
| 2025 | 2026 | 2027 | 2028 | 2029 | 2030 | 2031 | 2032 | 2033 | 2034 | |
| Levered FCF ($, Millions) | US$801.2m | US$896.9m | US$937.7m | US$987.2m | US$936.7m | US$911.8m | US$901.4m | US$900.6m | US$906.5m | US$917.1m |
| Growth Rate Estimate Source | Analyst x12 | Analyst x10 | Analyst x5 | Analyst x2 | Analyst x1 | Est @ -2.66% | Est @ -1.15% | Est @ -0.09% | Est @ 0.65% | Est @ 1.17% |
| Present Value ($, Millions) Discounted @ 6.9% | US$749 | US$784 | US$767 | US$755 | US$670 | US$610 | US$564 | US$527 | US$496 | US$469 |
("Est" = FCF growth rate estimated by Simply Wall St)
Present Value of 10-year Cash Flow (PVCF) = US$6.4b
After calculating the present value of future cash flows in the initial 10-year period, we need to calculate the Terminal Value, which accounts for all future cash flows beyond the first stage. The Gordon Growth formula is used to calculate Terminal Value at a future annual growth rate equal to the 5-year average of the 10-year government bond yield of 2.4%. We discount the terminal cash flows to today's value at a cost of equity of 6.9%.
Terminal Value (TV)= FCF2034 × (1 + g) ÷ (r – g) = US$917m× (1 + 2.4%) ÷ (6.9%– 2.4%) = US$21b
Present Value of Terminal Value (PVTV)= TV / (1 + r)10= US$21b÷ ( 1 + 6.9%)10= US$11b
The total value, or equity value, is then the sum of the present value of the future cash flows, which in this case is US$17b. The last step is to then divide the equity value by the number of shares outstanding. Compared to the current share price of US$53.5, the company appears quite good value at a 35% discount to where the stock price trades currently. Valuations are imprecise instruments though, rather like a telescope - move a few degrees and end up in a different galaxy. Do keep this in mind.
Important Assumptions
The calculation above is very dependent on two assumptions. The first is the discount rate and the other is the cash flows. If you don't agree with these result, have a go at the calculation yourself and play with the assumptions. The DCF also does not consider the possible cyclicality of an industry, or a company's future capital requirements, so it does not give a full picture of a company's potential performance. Given that we are looking at DocuSign as potential shareholders, the cost of equity is used as the discount rate, rather than the cost of capital (or weighted average cost of capital, WACC) which accounts for debt. In this calculation we've used 6.9%, which is based on a levered beta of 0.989. Beta is a measure of a stock's volatility, compared to the market as a whole. We get our beta from the industry average beta of globally comparable companies, with an imposed limit between 0.8 and 2.0, which is a reasonable range for a stable business.
SWOT Analysis for DocuSign
Strength
- Currently debt free.
Weakness
- No major weaknesses identified for DOCU.
Opportunity
- Annual earnings are forecast to grow faster than the American market.
- Trading below our estimate of fair value by more than 20%.
Threat
- Annual revenue is forecast to grow slower than the American market.
Next Steps:
Whilst important, the DCF calculation shouldn't be the only metric you look at when researching a company. DCF models are not the be-all and end-all of investment valuation. Rather it should be seen as a guide to "what assumptions need to be true for this stock to be under/overvalued?" For instance, if the terminal value growth rate is adjusted slightly, it can dramatically alter the overall result. Can we work out why the company is trading at a discount to intrinsic value? For DocuSign, there are three relevant aspects you should further examine:
- Risks: For example, we've discovered 1 warning sign for DocuSign that you should be aware of before investing here.
- Management:Have insiders been ramping up their shares to take advantage of the market's sentiment for DOCU's future outlook? Check out our management and board analysis with insights on CEO compensation and governance factors.
- Other High Quality Alternatives: Do you like a good all-rounder? Explore our interactive list of high quality stocks to get an idea of what else is out there you may be missing!
PS. Simply Wall St updates its DCF calculation for every American stock every day, so if you want to find the intrinsic value of any other stock just search here.
New: Manage All Your Stock Portfolios in One Place
We've created the ultimate portfolio companion for stock investors, and it's free.
• Connect an unlimited number of Portfolios and see your total in one currency
• Be alerted to new Warning Signs or Risks via email or mobile
• Track the Fair Value of your stocks
Have feedback on this article? Concerned about the content? Get in touch with us directly. Alternatively, email editorial-team (at) simplywallst.com.
This article by Simply Wall St is general in nature. We provide commentary based on historical data and analyst forecasts only using an unbiased methodology and our articles are not intended to be financial advice. It does not constitute a recommendation to buy or sell any stock, and does not take account of your objectives, or your financial situation. We aim to bring you long-term focused analysis driven by fundamental data. Note that our analysis may not factor in the latest price-sensitive company announcements or qualitative material. Simply Wall St has no position in any stocks mentioned.
Have feedback on this article? Concerned about the content? Get in touch with us directly. Alternatively, email editorial-team@simplywallst.com
About NasdaqGS:DOCU
DocuSign
Provides electronic signature solution in the United States and internationally.
Excellent balance sheet and fair value.
Similar Companies
Market Insights

Advertisement
Weekly Picks
WE


WealthAP on PayPal Holdings ·
The "Sleeping Giant" Stumbles, Then Wakes Up
Fair Value:US$8229.7% undervalued
47 followersusers have followed this narrative
4 commentsusers have commented on this narrative
28 likesusers have liked this narrative
WO

woodworthfund on Bumble ·
Swiped Left by Wall Street: The BMBL Rebound Trade
Fair Value:US$961.3% undervalued
15 followersusers have followed this narrative
0 commentsusers have commented on this narrative
6 likesusers have liked this narrative
WE

WealthAP on Duolingo ·
Duolingo (DUOL): Why A 20% Drop Might Be The Entry Point We've Been Waiting For
Fair Value:US$268.6434.2% undervalued
32 followersusers have followed this narrative
5 commentsusers have commented on this narrative
8 likesusers have liked this narrative
Recently Updated Narratives
YI

yiannisz on Alphabet ·
The Real Power Behind Alphabet’s Growth
Fair Value:US$192.5470.7% overvalued
22 followersusers have followed this narrative
1 commentusers have commented on this narrative
0 likesusers have liked this narrative
YI

yiannisz on RELX ·
RELX: The Quiet Compounder Powering Law, Science, and Risk Intelligence
Fair Value:US$41.224.7% overvalued
1 followerusers have followed this narrative
0 commentsusers have commented on this narrative
0 likesusers have liked this narrative
YI

yiannisz on CVS Health ·
Why CVS’s Valuation Signals Opportunity
Fair Value:US$104.0122.8% undervalued
102 followersusers have followed this narrative
9 commentsusers have commented on this narrative
0 likesusers have liked this narrative
Popular Narratives
AG


Agricola on Excellon Resources ·
A case for CA$31.80 (undiluted), aka 8,616% upside from CA$0.37 (an 86 bagger!).
Fair Value:CA$31.898.3% undervalued
70 followersusers have followed this narrative
13 commentsusers have commented on this narrative
23 likesusers have liked this narrative
AN


AnalystConsensusTarget on NVIDIA ·
NVDA: Expanding AI Demand Will Drive Major Data Center Investments Through 2026
Fair Value:US$253.0226.9% undervalued
1029 followersusers have followed this narrative
6 commentsusers have commented on this narrative
29 likesusers have liked this narrative
AL

AlexLovell on Rocket Lab ·
Early mover in a fast growing industry. Likely to experience share price volatility as they scale
Fair Value:US$16.25422.2% overvalued
73 followersusers have followed this narrative
1 commentusers have commented on this narrative
18 likesusers have liked this narrative