Advertisement
- United States
- /
- Software
- /
- NasdaqGS:CYBR
Is Now the Right Moment for CyberArk After Shares Surge Nearly 70% in a Year?

Simply Wall St
Reviewed by Bailey Pemberton
Thinking about buying, selling, or just hanging on to CyberArk Software stock? You are not alone. This cybersecurity specialist has caught the eye of investors as it keeps notching new highs, but deciding what to do next can feel tricky. Over the last week, shares crept up 0.6%, and in the past month, they have climbed an impressive 5.3%. Those numbers only scratch the surface; since the start of this year, CyberArk is up 47.0%, and the last twelve months have seen the stock rocket nearly 70%. Cast your gaze further back and the story gets even more remarkable, with stunning gains of 266.9% over three years and a whopping 336.7% over five years.
Such momentum rarely happens in a vacuum. As the broader market continues to reward select software names, investors seem to be pricing in CyberArk’s role in digital security, a sector now viewed as essential rather than optional. Yet for all this excitement, the big question remains: is CyberArk undervalued, fairly priced, or showing signs of overheating? On our standard six-point value check, CyberArk does not tick a single undervalued box, scoring just 0 out of 6.
Understanding how the market values a fast-moving stock like this is not just about reading the latest chart or headline. Next, we will break down the main valuation methods and what they reveal about CyberArk’s current price. Stick around to the very end for an even smarter way to make sense of all the numbers that go into valuing a stock like this.
CyberArk Software scores just 0/6 on our valuation checks. See what other red flags we found in the full valuation breakdown.
Approach 1: CyberArk Software Discounted Cash Flow (DCF) Analysis
The Discounted Cash Flow (DCF) model estimates a company's intrinsic value by projecting its future cash flows and discounting them back to today's dollars. In essence, it asks: if you could own all the future cash the business will generate, what would that be worth to you now?
For CyberArk Software, the latest reported Free Cash Flow stands at $209 million. According to analyst forecasts and Simply Wall St’s extrapolations, those cash flows are expected to accelerate quickly, reaching $1.03 billion by 2029 and over $2.1 billion by 2035. It is worth noting that while analyst coverage provides a clearer picture over the next five years, numbers beyond 2029 are more uncertain and based on extrapolated growth rates.
Based on these cash flow projections, the DCF model calculates an intrinsic value of $332.57 per share. When compared to CyberArk’s current price, this suggests the stock is trading at a 48.4% premium to its fair value. In short, the DCF approach indicates the shares are significantly overvalued at today’s levels.
Result: OVERVALUED
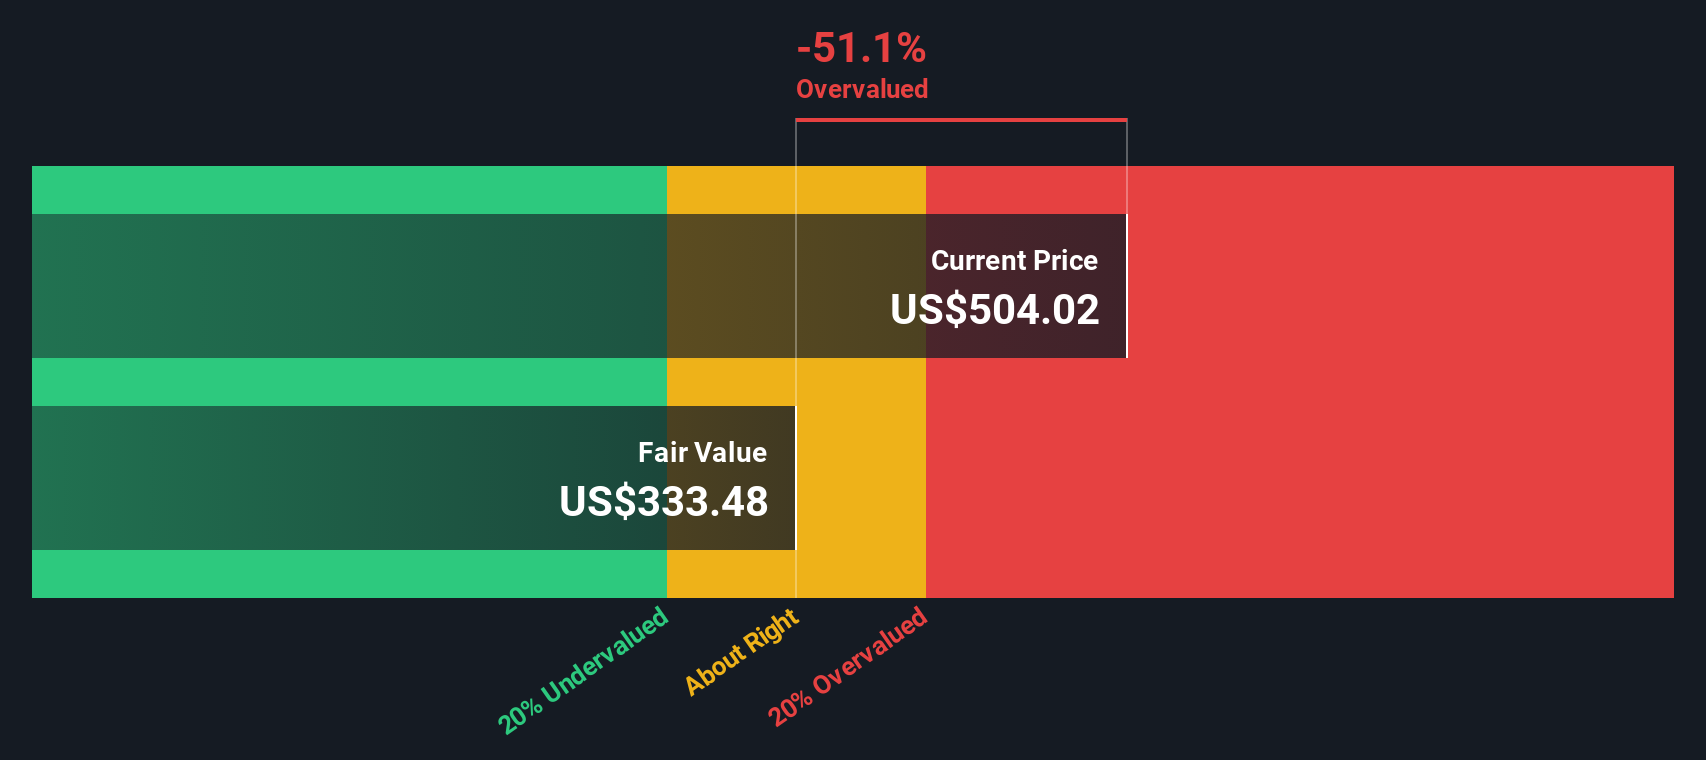
Our Discounted Cash Flow (DCF) analysis suggests CyberArk Software may be overvalued by 48.4%. Find undervalued stocks or create your own screener to find better value opportunities.
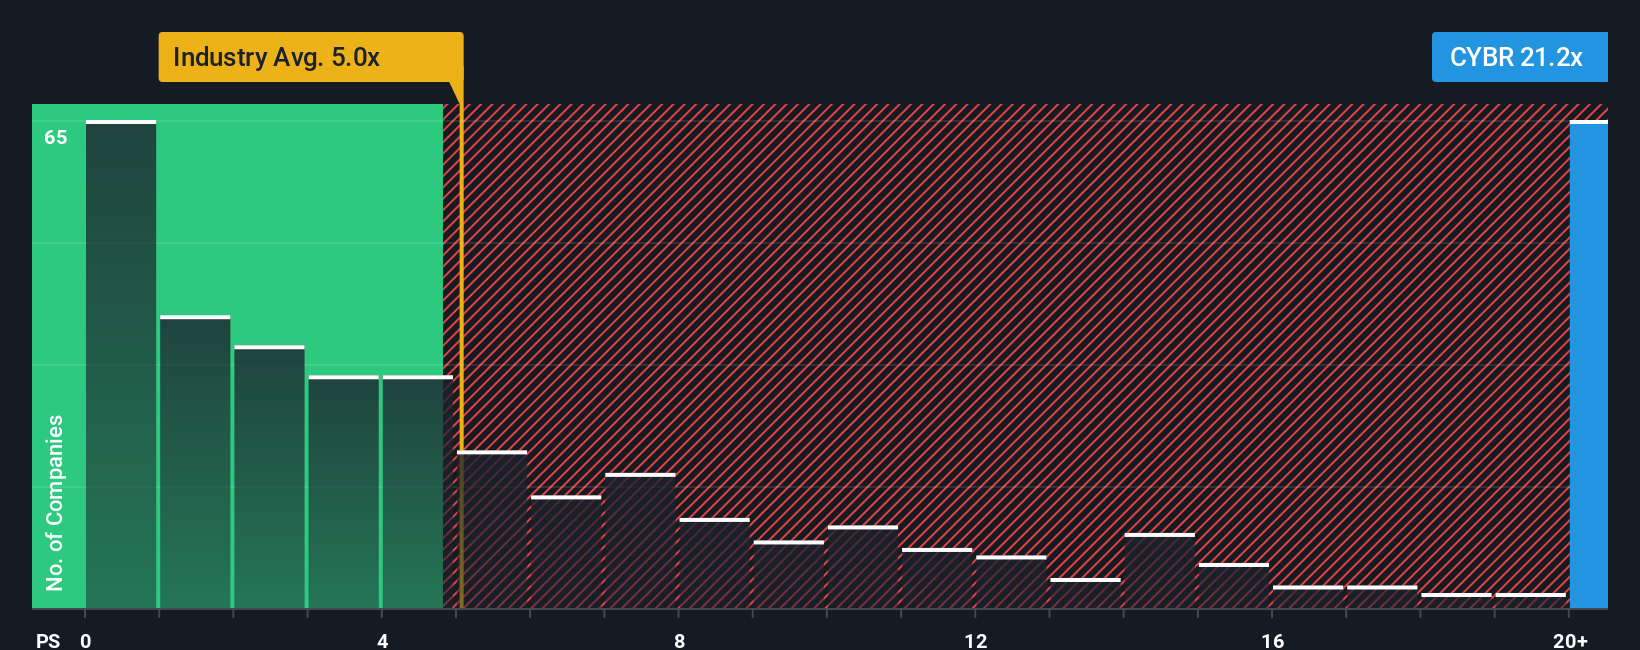
Approach 2: CyberArk Software Price vs Sales
For companies like CyberArk Software that are not currently profitable, the Price-to-Sales (P/S) ratio is a favored valuation measure. This multiple is especially relevant because it compares the market’s valuation of the company directly to its revenues, making it useful when profits are negative or volatile. While earnings-based multiples like Price-to-Earnings are typically used for mature, profitable firms, growth-stage companies in fast-evolving industries often see revenues build ahead of bottom-line profits. As a result, P/S provides a more meaningful benchmark.
Growth expectations and risk play a major role in judging whether a high P/S ratio is justified. Companies with strong revenue growth potential or operating in sectors with less risk can often support a higher "normal" or “fair” P/S ratio. In contrast, slower-growth or riskier businesses command lower multiples. For context, CyberArk trades at a P/S ratio of 20.76x. This compares with the software industry average of 5.18x and a peer average of 11.29x, both considerably lower than CyberArk’s current valuation.
To refine this analysis, Simply Wall St uses a proprietary “Fair Ratio.” This metric estimates the multiple that makes sense for CyberArk by integrating its earnings growth, profit margins, industry, risks, and market cap, offering a tailored baseline rather than a blunt company-to-company comparison. Because it takes into account CyberArk’s specific circumstances, the Fair Ratio of 10.83x offers a more nuanced perspective than simply relying on peers or sector averages.
With CyberArk’s P/S at 20.76x versus a Fair Ratio of 10.83x, the stock appears to be trading substantially above what would be considered fair value on this measure.
Result: OVERVALUED
PS ratios tell one story, but what if the real opportunity lies elsewhere? Discover companies where insiders are betting big on explosive growth.
Upgrade Your Decision Making: Choose your CyberArk Software Narrative
Earlier we mentioned there is an even better way to understand valuation, so let’s introduce you to Narratives, a unique approach that connects your view of a company with a dynamic, personalized forecast and fair value estimate.
A Narrative gives you the power to turn your research and perspective on CyberArk Software into a story, tying together assumptions about future growth, margins, and risks with a specific estimate of what the company is worth. It bridges the gap between the headlines and the numbers, helping you make clear, confident decisions about whether to buy, sell, or hold based on a comparison of Fair Value and the current Price.
Available right now on Simply Wall St’s Community page (used by millions of investors globally), Narratives are easy to use and automatically update when fresh information, such as news or earnings, comes in. This means your outlook on CyberArk can stay as current as the market itself, without extra effort.
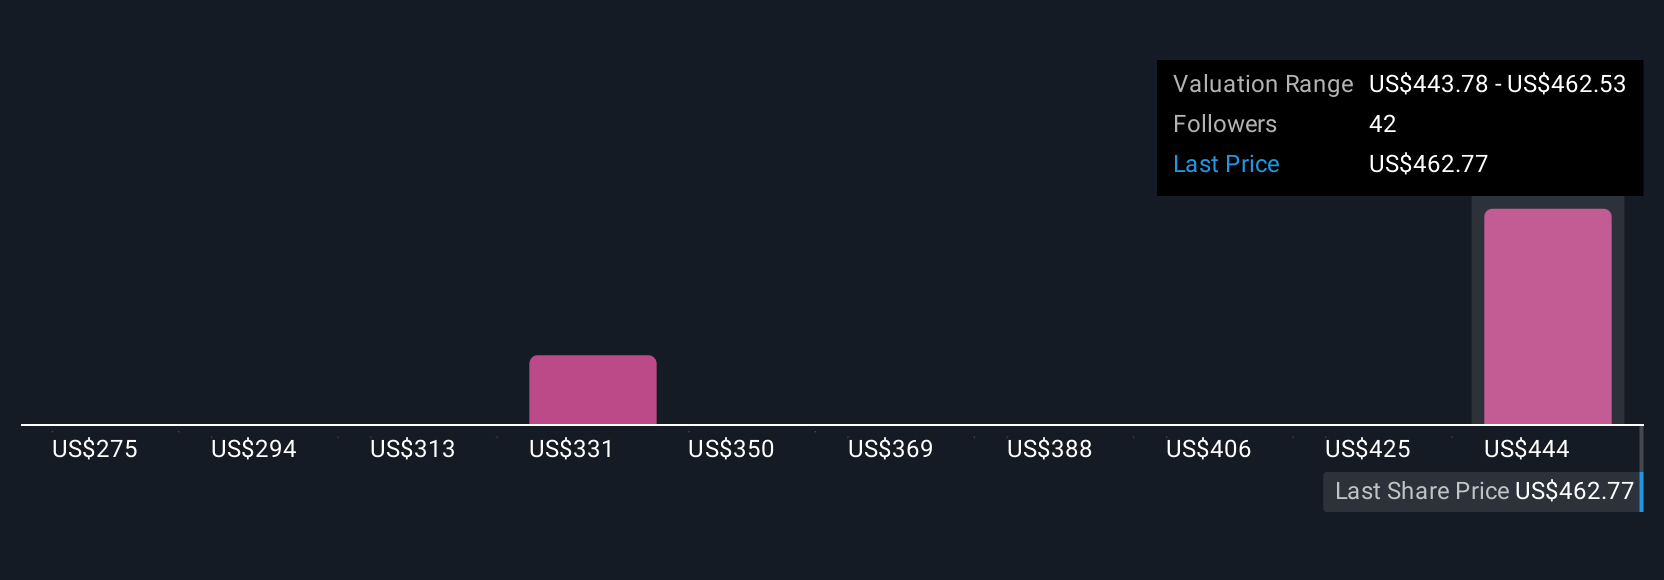
Different investors can have very different Narratives; for example, the highest price target for CyberArk is $551, while the lowest is $415, reflecting each user’s distinct take on its future prospects and risks.
Do you think there's more to the story for CyberArk Software? Create your own Narrative to let the Community know!
This article by Simply Wall St is general in nature. We provide commentary based on historical data and analyst forecasts only using an unbiased methodology and our articles are not intended to be financial advice. It does not constitute a recommendation to buy or sell any stock, and does not take account of your objectives, or your financial situation. We aim to bring you long-term focused analysis driven by fundamental data. Note that our analysis may not factor in the latest price-sensitive company announcements or qualitative material. Simply Wall St has no position in any stocks mentioned.
New: AI Stock Screener & Alerts
Our new AI Stock Screener scans the market every day to uncover opportunities.
• Dividend Powerhouses (3%+ Yield)
• Undervalued Small Caps with Insider Buying
• High growth Tech and AI Companies
Or build your own from over 50 metrics.
Have feedback on this article? Concerned about the content? Get in touch with us directly. Alternatively, email editorial-team@simplywallst.com
About NasdaqGS:CYBR
CyberArk Software
Develops, markets, and sells software-based identity security solutions and services in the United States, Israel, the United Kingdom, Europe, the Middle East, Africa, and internationally.
Flawless balance sheet with reasonable growth potential.
Similar Companies
Market Insights

Advertisement
Community Narratives
A formidable player in AI and enterprise computing.
Fair Value US$210.00|12.2% overvalued
CO
Community Contributor
IREN's Bold Moves in Sustainable Bitcoin Mining & AI Data Centers
Fair Value US$72.52|17.1% undervalued
BL
Community Contributor
Cooling the Champions: The Aussie Tech Behind F1's Victories
Fair Value AU$12.40|38.7% undervalued
TR
Community Contributor