If you are weighing what to do with Autodesk stock, you are definitely not alone. Lately, investors have watched as Autodesk’s share price has climbed roughly 14.5% over the past year, despite some choppy stretches that included a gentle pullback in recent months. For context, the stock closed recently at $288.63, still well off many analysts’ price targets. This suggests a potential upside of almost 18% from here. Each blip and rebound seems to reflect fresh views on Autodesk’s long-term growth story and evolving risk profile, often swinging as market sentiment shifts toward growth stocks or away from perceived uncertainty.
Company performance is nothing to sneeze at, either. Autodesk has posted annual revenue growth close to 10% and net income growth of more than 17%. These numbers might seem to justify investor optimism or even FOMO for some. But when it comes to valuation, the story gets more nuanced. By our six-point value framework, Autodesk scores a 2, meaning it looks undervalued in two out of six key checks. In other words, the stock does not fit cleanly into any ‘cheap’ or ‘expensive’ box, though there may be an interesting opportunity hiding in plain sight.
So how do these different valuation approaches stack up, and what might investors be missing? Let’s break down the major methods, then consider an even better way to cut through the noise, coming up at the end of the article.
Autodesk delivered 14.5% returns over the last year. See how this stacks up to the rest of the Software industry.
Advertisement
Approach 1: Autodesk Cash Flows
A Discounted Cash Flow (DCF) model helps estimate a company’s true value by projecting its future free cash flows and discounting those back to today’s dollars. This approach gives investors a sense of what the business is worth if growth matches expectations.
For Autodesk, current Free Cash Flow stands at $1.60 billion, reflecting strong annual increases. Analysts see that figure climbing steadily, with projections reaching $5.17 billion by 2035. This robust growth supports a two-stage DCF analysis, which calculates an estimated fair value for Autodesk at $313.53 per share.
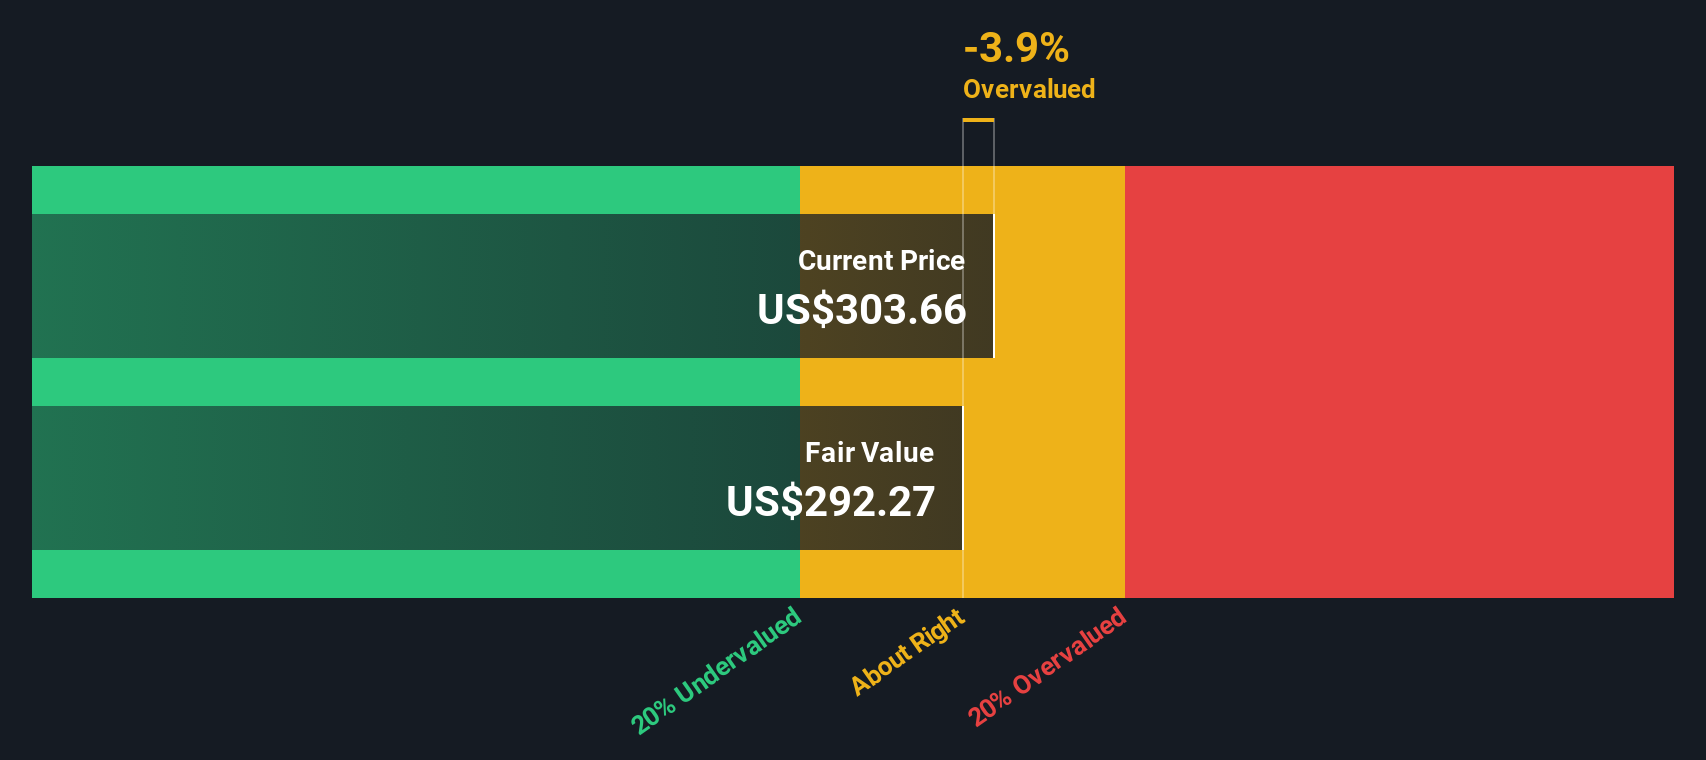
With the stock recently trading at $288.63, Autodesk appears about 7.9% undervalued compared to this DCF-based intrinsic value. This suggests the market price is largely in line with long-term cash flow potential, leaving neither a significant bargain nor clear overpricing.
Result: ABOUT RIGHT ADSK Discounted Cash Flow as at Aug 2025 Simply Wall St performs a discounted cash flow (DCF) on every stock in the world every day (check out Autodesk's DCF analysis). We show the entire calculation in full. You can track the result in your watchlist or portfolio and be alerted when this changes.
Approach 2: Autodesk Price vs Earnings
For profitable companies like Autodesk, the Price-to-Earnings (PE) ratio is a popular tool because it connects a company’s stock price directly to its actual earnings. This gives investors a straightforward sense of how the market values each dollar of profit. Higher growth expectations or lower perceived risk can justify a higher “normal” PE ratio, as investors are often willing to pay more for future potential and stability.
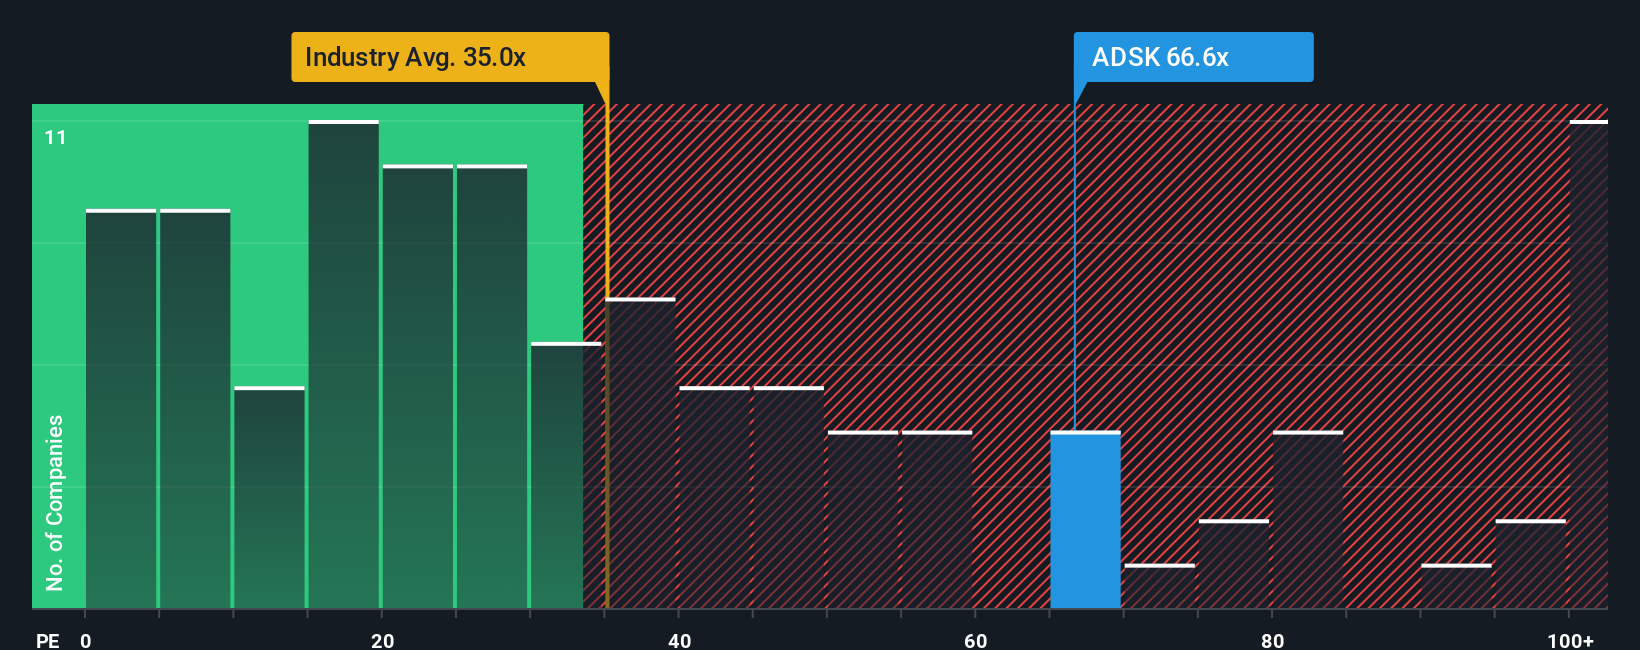
Currently, Autodesk trades at a PE ratio of 61.0x. This is notably higher than the Software industry average of 36.7x, but below the peer group average of 84.5x. Elevated multiples like this sometimes reflect optimism about a company's unique market position or superior growth prospects, but also attract added scrutiny from value-focused investors.
Looking at the Fair PE Ratio, a proprietary benchmark designed to account for Autodesk’s earnings growth, profitability, industry, and market cap, the fair value multiple is 40.5x. Comparing this to the actual PE of 61.0x suggests Autodesk’s shares are priced higher than what these fundamentals might justify. While its growth story is compelling, the current premium places the stock in OVERVALUED territory by this metric.
Upgrade Your Decision Making: Choose your Autodesk Narrative
A Narrative is your personal story or perspective about a company, combining what you know about its business with your own assumptions for future revenue, profit margins, and a fair value. Rather than just relying on stock charts or valuation ratios, Narratives allow you to connect the dots by linking Autodesk’s ongoing transformation and its financial potential into a single picture that guides your investment decisions.
On Simply Wall St, Narratives are simple to create and easy to update. They help millions of investors put their view into numbers, then compare their estimated fair value to the current share price to see if a stock is attractive or not. Since Narratives are updated dynamically as new information, like earnings or news, is released, you always have an up-to-date forecast that truly reflects your view of Autodesk’s future.
For example, the most optimistic Narrative for Autodesk expects a price target of $430.00 based on strong cloud and AI growth, while the most cautious sees it at $270.97, reflecting more measured expectations amidst industry risks. Narratives put you in control, letting you decide whether the market price fits your story and if it is time to buy, hold, or sell.
This article by Simply Wall St is general in nature. We provide commentary based on historical data
and analyst forecasts only using an unbiased methodology and our articles are not intended to be financial advice. It does not constitute a recommendation to buy or sell any stock, and does not take account of your objectives, or your
financial situation. We aim to bring you long-term focused analysis driven by fundamental data.
Note that our analysis may not factor in the latest price-sensitive company announcements or qualitative material.
Simply Wall St has no position in any stocks mentioned.
New: Manage All Your Stock Portfolios in One Place
We've created the ultimate portfolio companion for stock investors, and it's free.
• Connect an unlimited number of Portfolios and see your total in one currency • Be alerted to new Warning Signs or Risks via email or mobile • Track the Fair Value of your stocks