- United States
- /
- Semiconductors
- /
- NasdaqGS:INTC
Intel Shares Soar 51% as Panther Lake News Fuels Debate on True Value

Reviewed by Bailey Pemberton
If you have been watching Intel's stock recently, you have likely felt a bit of whiplash. After spending years in the market's penalty box, shares have jolted upward by an eye-catching 51.0% over the last month and now sit at $36.37. That brings Intel's year-to-date return to a staggering 79.9% and a one-year gain of 54.4%. Not bad for a company some had written off as past its prime.
So, what is fueling this newfound optimism? For starters, headline-makers like Panther Lake and the 18A process are making waves. Intel's own CTO describes these as "foundational to our future," and the company's aggressive bets on manufacturing are drawing keen interest, not just from investors, but from industry heavyweights and even U.S. policymakers. Add in the ongoing speculation about new foundry customers, and suddenly, risk perceptions are shifting, with more investors betting on Intel’s comeback story having legs.
With all this excitement, you might be wondering if the market has gotten ahead of itself or if Intel's still a bargain hiding in plain sight. Here is where it gets interesting: Intel currently clocks a value score of 5 out of 6, meaning it looks undervalued in almost every sense by standard valuation checks. But that is just the surface. Let's dive into the actual methods behind this score and explore if conventional valuation tools really tell the whole story, or if there is a smarter way to gauge what Intel is truly worth.
Approach 1: Intel Discounted Cash Flow (DCF) Analysis
The Discounted Cash Flow (DCF) model estimates what a business is worth today by projecting its future cash flows and bringing them back to present value using a discount rate. Essentially, it asks what is a reasonable price to pay now for a stream of cash flows that will arrive over the next decade and beyond.
In Intel's case, the company currently reports a Free Cash Flow (FCF) of negative $13.35 billion, reflecting heavy ongoing investments. Analyst consensus expects a return to positive FCF soon, with projections reaching $10.28 billion by 2028 and up to $31.9 billion by 2035, according to extrapolations. These future estimates are discounted to reflect their present worth, using a 2 Stage Free Cash Flow to Equity model. All calculations are in US dollars.
By tallying these discounted future cash flows, the DCF model calculates an intrinsic value of $46.54 per Intel share. With the market currently pricing shares at $36.37, the model implies that the stock is trading at a 21.9% discount to its estimated fair value.
Result: UNDERVALUED
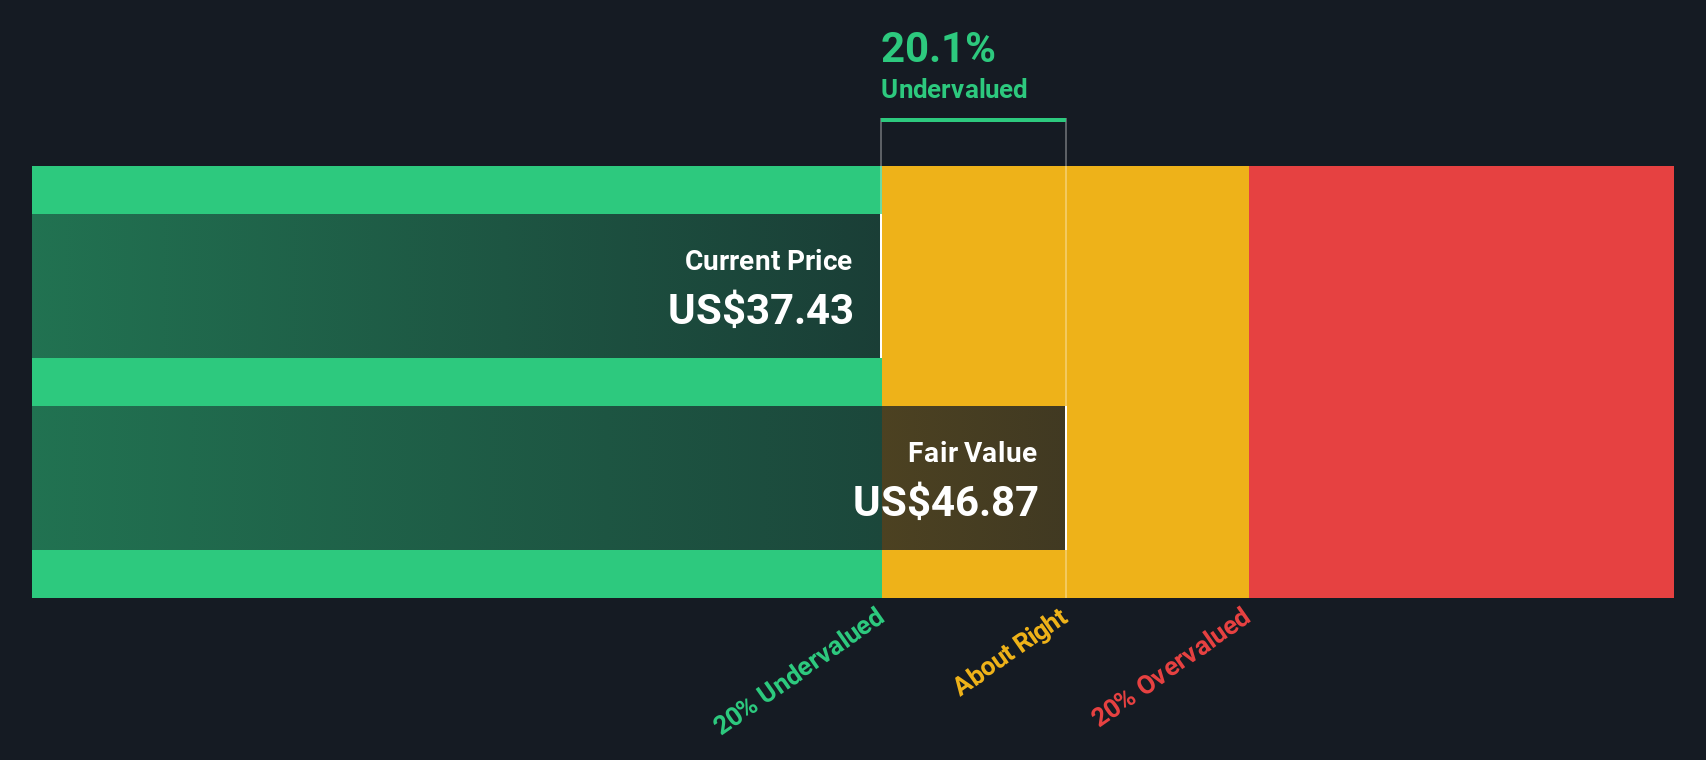
Our Discounted Cash Flow (DCF) analysis suggests Intel is undervalued by 21.9%. Track this in your watchlist or portfolio, or discover more undervalued stocks.
Approach 2: Intel Price vs Sales
When companies are cycling through periods of heavy investment or volatile earnings, like Intel is now, the Price-to-Sales (P/S) ratio can be a much better yardstick than Price-to-Earnings. This metric offers a clear look at how investors value each dollar of revenue, especially when profits temporarily dip below the line due to significant capital outlays or industry shifts.
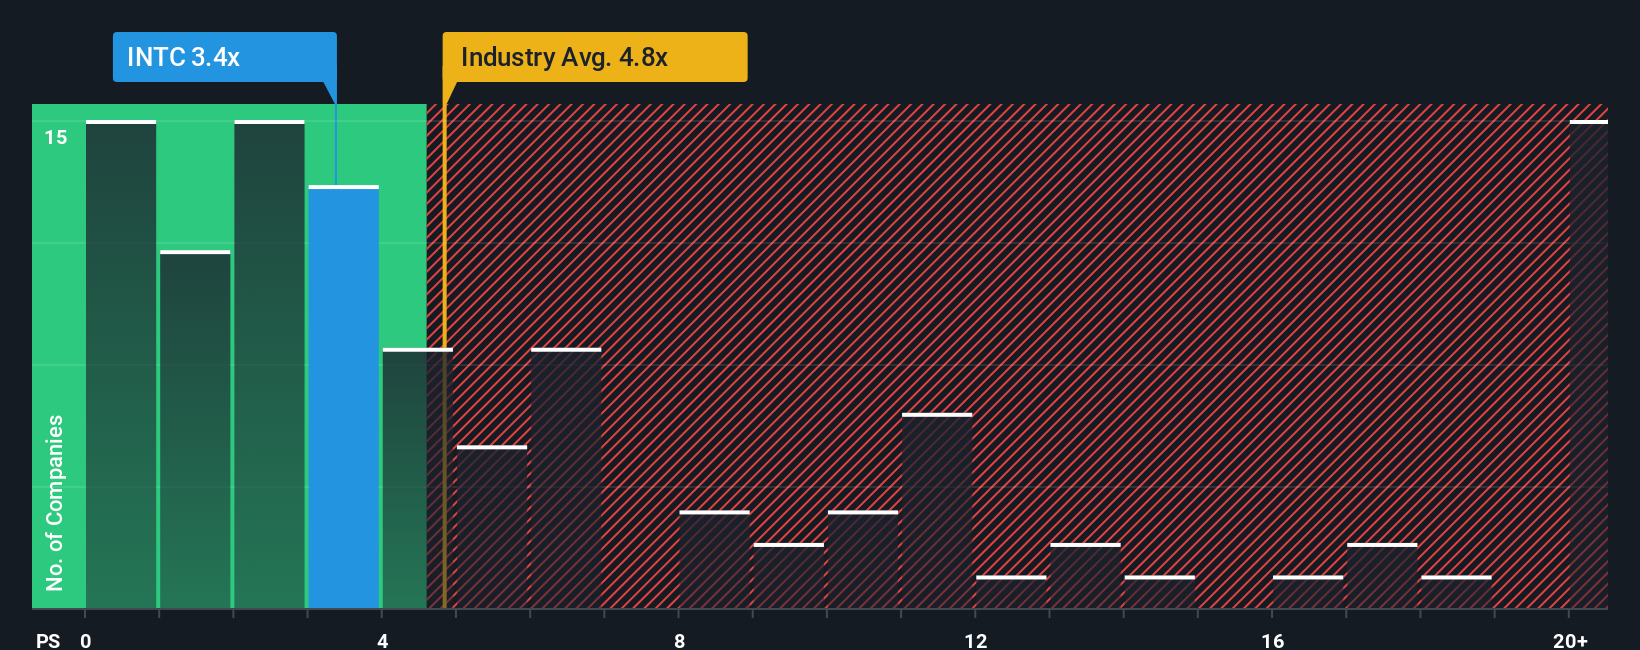
In terms of growth and risk, companies with higher expected sales growth or lower business risks usually justify a higher P/S multiple. Slower-growing or riskier firms tend to have a lower number. For context, Intel is currently trading at a P/S ratio of 3.26x. That is below the semiconductor industry average of 4.52x and significantly beneath the peer average of 15.91x.
Simply Wall St’s “Fair Ratio” goes further than typical industry or peer comparisons. By incorporating Intel’s expected revenue growth, profit margins, risk profile, and size, it arrives at a Fair Ratio of 5.24x for Intel. Since this tailored benchmark reflects more factors than peer comparisons alone, it provides a more grounded basis for what the stock might “properly” trade at in today’s market.
With Intel’s current P/S ratio of 3.26x sitting well below the Fair Ratio of 5.24x, the data suggests that the market may still undervalue the company’s long-term potential, even after recent gains.
Result: UNDERVALUED
PS ratios tell one story, but what if the real opportunity lies elsewhere? Discover companies where insiders are betting big on explosive growth.
Upgrade Your Decision Making: Choose your Intel Narrative
Earlier we mentioned that there is an even better way to understand valuation, so let’s introduce you to Narratives. A Narrative is simply your story behind the numbers. You choose what you believe Intel’s future will look like, quantify that with your own revenue or margin assumptions, and instantly see what fair value that would imply for the stock.
Narratives bring together the company’s big picture, your forecasts, and a fair value estimate, giving you a more meaningful and actionable view than any single metric. On Simply Wall St’s Community page, Narratives are easy for anyone to explore and create, and millions of investors already use them to make their decisions.
By comparing each Narrative’s calculated fair value to the current share price, you can quickly see whether it signals a buy, a sell, or a wait-and-see stance. Because Narratives update automatically whenever new news or results are published, your analysis stays relevant without any extra effort.
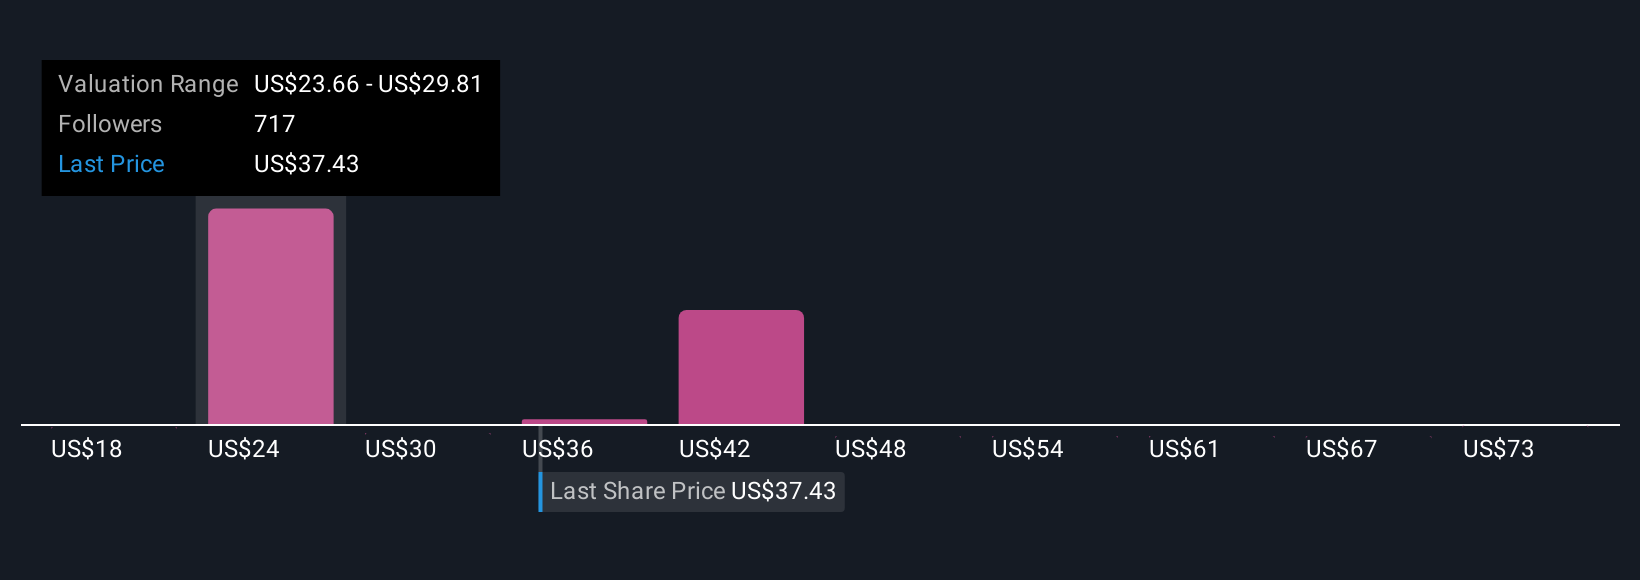
For example, the most optimistic Intel Narrative currently suggests a fair value of $28.30 per share, while the most bearish sits at $14.00, showing just how different your conclusion can be depending on your outlook.
Do you think there's more to the story for Intel? Create your own Narrative to let the Community know!
This article by Simply Wall St is general in nature. We provide commentary based on historical data and analyst forecasts only using an unbiased methodology and our articles are not intended to be financial advice. It does not constitute a recommendation to buy or sell any stock, and does not take account of your objectives, or your financial situation. We aim to bring you long-term focused analysis driven by fundamental data. Note that our analysis may not factor in the latest price-sensitive company announcements or qualitative material. Simply Wall St has no position in any stocks mentioned.
The New Payments ETF Is Live on NASDAQ:
Money is moving to real-time rails, and a newly listed ETF now gives investors direct exposure. Fast settlement. Institutional custody. Simple access.
Explore how this launch could reshape portfolios
Sponsored ContentNew: AI Stock Screener & Alerts
Our new AI Stock Screener scans the market every day to uncover opportunities.
• Dividend Powerhouses (3%+ Yield)
• Undervalued Small Caps with Insider Buying
• High growth Tech and AI Companies
Or build your own from over 50 metrics.
Have feedback on this article? Concerned about the content? Get in touch with us directly. Alternatively, email editorial-team@simplywallst.com
About NasdaqGS:INTC
Intel
Designs, develops, manufactures, markets, and sells computing and related products and services worldwide.
Fair value with moderate growth potential.
Similar Companies
Market Insights


Weekly Picks

Early mover in a fast growing industry. Likely to experience share price volatility as they scale


A case for CA$31.80 (undiluted), aka 8,616% upside from CA$0.37 (an 86 bagger!).


Moderation and Stabilisation: HOLD: Fair Price based on a 4-year Cycle is $12.08
Recently Updated Narratives

Airbnb Stock: Platform Growth in a World of Saturation and Scrutiny

Adobe Stock: AI-Fueled ARR Growth Pushes Guidance Higher, But Cost Pressures Loom

Thomson Reuters Stock: When Legal Intelligence Becomes Mission-Critical Infrastructure
Popular Narratives


Crazy Undervalued 42 Baggers Silver Play (Active & Running Mine)


NVDA: Expanding AI Demand Will Drive Major Data Center Investments Through 2026

The AI Infrastructure Giant Grows Into Its Valuation
Trending Discussion


