
Advertisement
- United States
- /
- Specialty Stores
- /
- NYSE:ABG
Here's What We Learnt About The CEO Pay At Asbury Automotive Group, Inc. (NYSE:ABG)

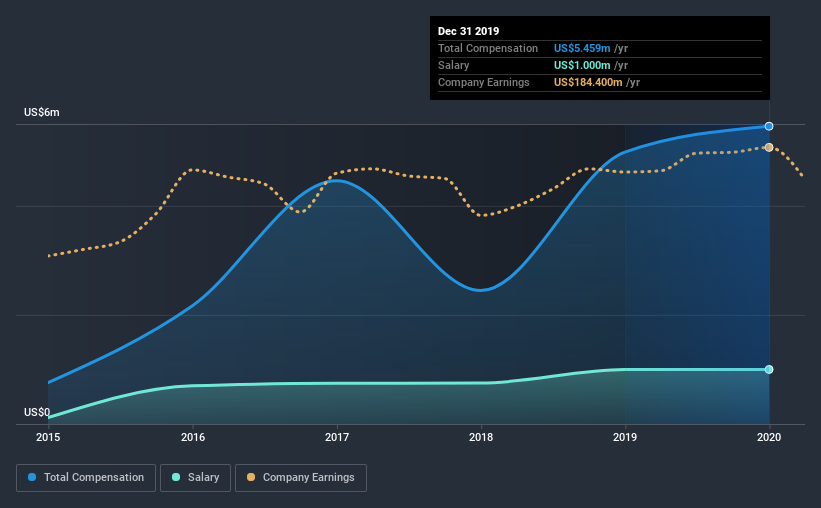
David Hult has been the CEO of Asbury Automotive Group, Inc. (NYSE:ABG) since 2018, and this article will examine the executive's compensation with respect to the overall performance of the company. This analysis will also evaluate the appropriateness of CEO compensation when taking into account the earnings and shareholder returns of the company.
View our latest analysis for Asbury Automotive Group
How Does Total Compensation For David Hult Compare With Other Companies In The Industry?
At the time of writing, our data shows that Asbury Automotive Group, Inc. has a market capitalization of US$1.5b, and reported total annual CEO compensation of US$5.5m for the year to December 2019. That's a notable increase of 9.5% on last year. We think total compensation is more important but our data shows that the CEO salary is lower, at US$1.0m.
On comparing similar companies from the same industry with market caps ranging from US$1.0b to US$3.2b, we found that the median CEO total compensation was US$6.9m. So it looks like Asbury Automotive Group compensates David Hult in line with the median for the industry. Furthermore, David Hult directly owns US$4.5m worth of shares in the company, implying that they are deeply invested in the company's success.
| Component | 2019 | 2018 | Proportion (2019) |
| Salary | US$1.0m | US$1.0m | 18% |
| Other | US$4.5m | US$4.0m | 82% |
| Total Compensation | US$5.5m | US$5.0m | 100% |
Talking in terms of the industry, salary represented approximately 20% of total compensation out of all the companies we analyzed, while other remuneration made up 80% of the pie. Asbury Automotive Group pays a modest slice of remuneration through salary, as compared to the broader industry. It's important to note that a slant towards non-salary compensation suggests that total pay is tied to the company's performance.
A Look at Asbury Automotive Group, Inc.'s Growth Numbers
Over the past three years, Asbury Automotive Group, Inc. has seen its earnings per share (EPS) grow by 2.9% per year. It achieved revenue growth of 3.0% over the last year.
We'd prefer higher revenue growth, but we're happy with the modest EPS growth. It's clear the performance has been quite decent, but it it falls short of outstanding,based on this information. Looking ahead, you might want to check this free visual report on analyst forecasts for the company's future earnings..
Has Asbury Automotive Group, Inc. Been A Good Investment?
We think that the total shareholder return of 38%, over three years, would leave most Asbury Automotive Group, Inc. shareholders smiling. So they may not be at all concerned if the CEO were to be paid more than is normal for companies around the same size.
To Conclude...
As we noted earlier, Asbury Automotive Group pays its CEO in line with similar-sized companies belonging to the same industry. However, the company's earnings growth numbers over the last three years is not that impressive. At the same time, shareholder returns have remained strong over the same period. We would like to see EPS growth from the business, although we wouldn't say the CEO compensation is high.
CEO compensation is an important area to keep your eyes on, but we've also need to pay attention to other attributes of the company. We identified 3 warning signs for Asbury Automotive Group (1 is potentially serious!) that you should be aware of before investing here.
Of course, you might find a fantastic investment by looking at a different set of stocks. So take a peek at this free list of interesting companies.
When trading Asbury Automotive Group or any other investment, use the platform considered by many to be the Professional's Gateway to the Worlds Market, Interactive Brokers. You get the lowest-cost* trading on stocks, options, futures, forex, bonds and funds worldwide from a single integrated account.Promoted
New: Manage All Your Stock Portfolios in One Place
We've created the ultimate portfolio companion for stock investors, and it's free.
• Connect an unlimited number of Portfolios and see your total in one currency
• Be alerted to new Warning Signs or Risks via email or mobile
• Track the Fair Value of your stocks
This article by Simply Wall St is general in nature. It does not constitute a recommendation to buy or sell any stock, and does not take account of your objectives, or your financial situation. We aim to bring you long-term focused analysis driven by fundamental data. Note that our analysis may not factor in the latest price-sensitive company announcements or qualitative material. Simply Wall St has no position in any stocks mentioned.
*Interactive Brokers Rated Lowest Cost Broker by StockBrokers.com Annual Online Review 2020
Have feedback on this article? Concerned about the content? Get in touch with us directly. Alternatively, email editorial-team@simplywallst.com.
About NYSE:ABG
Asbury Automotive Group
Operates as an automotive retailer in the United States.
Undervalued with mediocre balance sheet.
Similar Companies
Market Insights

Advertisement
Community Narratives
Scaling up in building materials with smart M&A and growing profitability
Fair Value US$2.77|24.5% undervalued
CM
Community Contributor
Hims: The Platform Powering Personalised Healthcare
Fair Value US$114.01|45.3% undervalued
BL
Community Contributor
Undervalued lottery company with strong fundamentals
Fair Value AU$15.00|33.9% undervalued
RO
Community Contributor
Proximus, transferring money from the impatient to the patient investor
Fair Value €16.62|57.0% undervalued
AX
Community Contributor