- United States
- /
- Biotech
- /
- NasdaqGS:RVMD
Calculating The Intrinsic Value Of Revolution Medicines, Inc. (NASDAQ:RVMD)


Key Insights
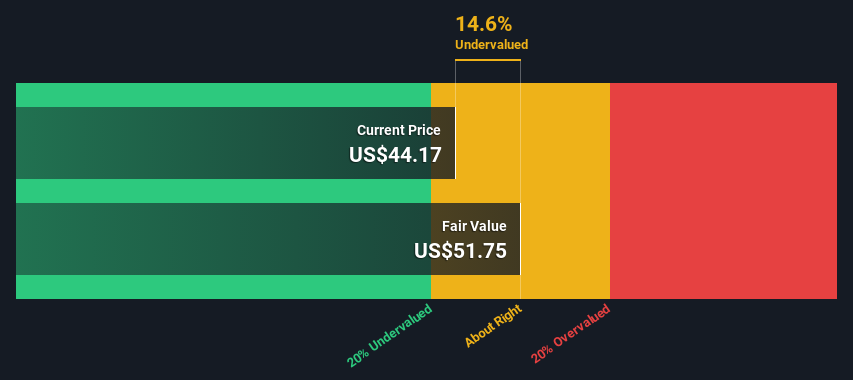
- Using the 2 Stage Free Cash Flow to Equity, Revolution Medicines fair value estimate is US$51.75
- Current share price of US$44.17 suggests Revolution Medicines is potentially trading close to its fair value
- Our fair value estimate is 13% lower than Revolution Medicines' analyst price target of US$59.64
How far off is Revolution Medicines, Inc. (NASDAQ:RVMD) from its intrinsic value? Using the most recent financial data, we'll take a look at whether the stock is fairly priced by estimating the company's future cash flows and discounting them to their present value. One way to achieve this is by employing the Discounted Cash Flow (DCF) model. It may sound complicated, but actually it is quite simple!
We generally believe that a company's value is the present value of all of the cash it will generate in the future. However, a DCF is just one valuation metric among many, and it is not without flaws. Anyone interested in learning a bit more about intrinsic value should have a read of the Simply Wall St analysis model.
See our latest analysis for Revolution Medicines
The Model
We use what is known as a 2-stage model, which simply means we have two different periods of growth rates for the company's cash flows. Generally the first stage is higher growth, and the second stage is a lower growth phase. In the first stage we need to estimate the cash flows to the business over the next ten years. Where possible we use analyst estimates, but when these aren't available we extrapolate the previous free cash flow (FCF) from the last estimate or reported value. We assume companies with shrinking free cash flow will slow their rate of shrinkage, and that companies with growing free cash flow will see their growth rate slow, over this period. We do this to reflect that growth tends to slow more in the early years than it does in later years.
Generally we assume that a dollar today is more valuable than a dollar in the future, so we discount the value of these future cash flows to their estimated value in today's dollars:
10-year free cash flow (FCF) forecast
| 2025 | 2026 | 2027 | 2028 | 2029 | 2030 | 2031 | 2032 | 2033 | 2034 | |
| Levered FCF ($, Millions) | -US$523.3m | -US$533.3m | -US$225.1m | US$156.3m | US$229.0m | US$305.1m | US$378.5m | US$445.0m | US$503.0m | US$552.8m |
| Growth Rate Estimate Source | Analyst x4 | Analyst x4 | Analyst x3 | Analyst x3 | Est @ 46.45% | Est @ 33.27% | Est @ 24.04% | Est @ 17.58% | Est @ 13.05% | Est @ 9.89% |
| Present Value ($, Millions) Discounted @ 6.3% | -US$492 | -US$472 | -US$188 | US$123 | US$169 | US$212 | US$247 | US$274 | US$291 | US$301 |
("Est" = FCF growth rate estimated by Simply Wall St)
Present Value of 10-year Cash Flow (PVCF) = US$464m
The second stage is also known as Terminal Value, this is the business's cash flow after the first stage. The Gordon Growth formula is used to calculate Terminal Value at a future annual growth rate equal to the 5-year average of the 10-year government bond yield of 2.5%. We discount the terminal cash flows to today's value at a cost of equity of 6.3%.
Terminal Value (TV)= FCF2034 × (1 + g) ÷ (r – g) = US$553m× (1 + 2.5%) ÷ (6.3%– 2.5%) = US$15b
Present Value of Terminal Value (PVTV)= TV / (1 + r)10= US$15b÷ ( 1 + 6.3%)10= US$8.2b
The total value, or equity value, is then the sum of the present value of the future cash flows, which in this case is US$8.6b. The last step is to then divide the equity value by the number of shares outstanding. Relative to the current share price of US$44.2, the company appears about fair value at a 15% discount to where the stock price trades currently. Valuations are imprecise instruments though, rather like a telescope - move a few degrees and end up in a different galaxy. Do keep this in mind.
Important Assumptions
We would point out that the most important inputs to a discounted cash flow are the discount rate and of course the actual cash flows. You don't have to agree with these inputs, I recommend redoing the calculations yourself and playing with them. The DCF also does not consider the possible cyclicality of an industry, or a company's future capital requirements, so it does not give a full picture of a company's potential performance. Given that we are looking at Revolution Medicines as potential shareholders, the cost of equity is used as the discount rate, rather than the cost of capital (or weighted average cost of capital, WACC) which accounts for debt. In this calculation we've used 6.3%, which is based on a levered beta of 0.915. Beta is a measure of a stock's volatility, compared to the market as a whole. We get our beta from the industry average beta of globally comparable companies, with an imposed limit between 0.8 and 2.0, which is a reasonable range for a stable business.
SWOT Analysis for Revolution Medicines
- Currently debt free.
- Shareholders have been diluted in the past year.
- Has sufficient cash runway for more than 3 years based on current free cash flows.
- Current share price is below our estimate of fair value.
- Not expected to become profitable over the next 3 years.
Looking Ahead:
Valuation is only one side of the coin in terms of building your investment thesis, and it is only one of many factors that you need to assess for a company. The DCF model is not a perfect stock valuation tool. Instead the best use for a DCF model is to test certain assumptions and theories to see if they would lead to the company being undervalued or overvalued. If a company grows at a different rate, or if its cost of equity or risk free rate changes sharply, the output can look very different. For Revolution Medicines, we've compiled three relevant items you should look at:
- Risks: For example, we've discovered 3 warning signs for Revolution Medicines (2 don't sit too well with us!) that you should be aware of before investing here.
- Future Earnings: How does RVMD's growth rate compare to its peers and the wider market? Dig deeper into the analyst consensus number for the upcoming years by interacting with our free analyst growth expectation chart.
- Other High Quality Alternatives: Do you like a good all-rounder? Explore our interactive list of high quality stocks to get an idea of what else is out there you may be missing!
PS. The Simply Wall St app conducts a discounted cash flow valuation for every stock on the NASDAQGS every day. If you want to find the calculation for other stocks just search here.
New: AI Stock Screener & Alerts
Our new AI Stock Screener scans the market every day to uncover opportunities.
• Dividend Powerhouses (3%+ Yield)
• Undervalued Small Caps with Insider Buying
• High growth Tech and AI Companies
Or build your own from over 50 metrics.
Have feedback on this article? Concerned about the content? Get in touch with us directly. Alternatively, email editorial-team (at) simplywallst.com.
This article by Simply Wall St is general in nature. We provide commentary based on historical data and analyst forecasts only using an unbiased methodology and our articles are not intended to be financial advice. It does not constitute a recommendation to buy or sell any stock, and does not take account of your objectives, or your financial situation. We aim to bring you long-term focused analysis driven by fundamental data. Note that our analysis may not factor in the latest price-sensitive company announcements or qualitative material. Simply Wall St has no position in any stocks mentioned.
About NasdaqGS:RVMD
Revolution Medicines
A clinical-stage precision oncology company, develops novel targeted therapies for RAS-addicted cancers.
Flawless balance sheet and fair value.
Market Insights

Community Narratives


