- United States
- /
- Biotech
- /
- NasdaqGM:LUMO
We're Keeping An Eye On Lumos Pharma's (NASDAQ:LUMO) Cash Burn Rate


There's no doubt that money can be made by owning shares of unprofitable businesses. For example, although software-as-a-service business Salesforce.com lost money for years while it grew recurring revenue, if you held shares since 2005, you'd have done very well indeed. But the harsh reality is that very many loss making companies burn through all their cash and go bankrupt.
Given this risk, we thought we'd take a look at whether Lumos Pharma (NASDAQ:LUMO) shareholders should be worried about its cash burn. In this article, we define cash burn as its annual (negative) free cash flow, which is the amount of money a company spends each year to fund its growth. We'll start by comparing its cash burn with its cash reserves in order to calculate its cash runway.
Check out our latest analysis for Lumos Pharma
Does Lumos Pharma Have A Long Cash Runway?
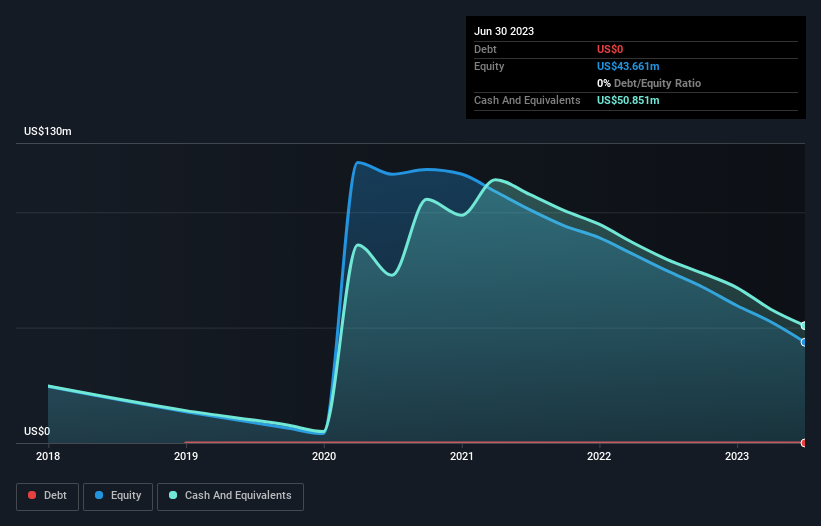
A company's cash runway is calculated by dividing its cash hoard by its cash burn. In June 2023, Lumos Pharma had US$51m in cash, and was debt-free. Looking at the last year, the company burnt through US$27m. So it had a cash runway of approximately 22 months from June 2023. While that cash runway isn't too concerning, sensible holders would be peering into the distance, and considering what happens if the company runs out of cash. Depicted below, you can see how its cash holdings have changed over time.
How Is Lumos Pharma's Cash Burn Changing Over Time?
Whilst it's great to see that Lumos Pharma has already begun generating revenue from operations, last year it only produced US$2.2m, so we don't think it is generating significant revenue, at this point. As a result, we think it's a bit early to focus on the revenue growth, so we'll limit ourselves to looking at how the cash burn is changing over time. As it happens, the company's cash burn reduced by 3.3% over the last year, which suggests that management are maintaining a fairly steady rate of business development, albeit with a slight decrease in spending. While the past is always worth studying, it is the future that matters most of all. So you might want to take a peek at how much the company is expected to grow in the next few years.
How Easily Can Lumos Pharma Raise Cash?
Even though it has reduced its cash burn recently, shareholders should still consider how easy it would be for Lumos Pharma to raise more cash in the future. Generally speaking, a listed business can raise new cash through issuing shares or taking on debt. Many companies end up issuing new shares to fund future growth. We can compare a company's cash burn to its market capitalisation to get a sense for how many new shares a company would have to issue to fund one year's operations.
Since it has a market capitalisation of US$24m, Lumos Pharma's US$27m in cash burn equates to about 113% of its market value. That suggests the company may have some funding difficulties, and we'd be very wary of the stock.
How Risky Is Lumos Pharma's Cash Burn Situation?
On this analysis of Lumos Pharma's cash burn, we think its cash runway was reassuring, while its cash burn relative to its market cap has us a bit worried. Summing up, we think the Lumos Pharma's cash burn is a risk, based on the factors we mentioned in this article. An in-depth examination of risks revealed 5 warning signs for Lumos Pharma that readers should think about before committing capital to this stock.
Of course, you might find a fantastic investment by looking elsewhere. So take a peek at this free list of companies insiders are buying, and this list of stocks growth stocks (according to analyst forecasts)
If you're looking to trade Lumos Pharma, open an account with the lowest-cost platform trusted by professionals, Interactive Brokers.
With clients in over 200 countries and territories, and access to 160 markets, IBKR lets you trade stocks, options, futures, forex, bonds and funds from a single integrated account.
Enjoy no hidden fees, no account minimums, and FX conversion rates as low as 0.03%, far better than what most brokers offer.
Sponsored ContentNew: AI Stock Screener & Alerts
Our new AI Stock Screener scans the market every day to uncover opportunities.
• Dividend Powerhouses (3%+ Yield)
• Undervalued Small Caps with Insider Buying
• High growth Tech and AI Companies
Or build your own from over 50 metrics.
Have feedback on this article? Concerned about the content? Get in touch with us directly. Alternatively, email editorial-team (at) simplywallst.com.
This article by Simply Wall St is general in nature. We provide commentary based on historical data and analyst forecasts only using an unbiased methodology and our articles are not intended to be financial advice. It does not constitute a recommendation to buy or sell any stock, and does not take account of your objectives, or your financial situation. We aim to bring you long-term focused analysis driven by fundamental data. Note that our analysis may not factor in the latest price-sensitive company announcements or qualitative material. Simply Wall St has no position in any stocks mentioned.
About NasdaqGM:LUMO
Lumos Pharma
A clinical-stage biopharmaceutical company, focuses on the identification, acquisition, development, and commercialization of products and therapies for people with rare diseases.
Medium-low with adequate balance sheet.

