- United States
- /
- Entertainment
- /
- NYSE:SPHR
While shareholders of Sphere Entertainment (NYSE:SPHR) are in the black over 3 years, those who bought a week ago aren't so fortunate


As an investor its worth striving to ensure your overall portfolio beats the market average. But its virtually certain that sometimes you will buy stocks that fall short of the market average returns. We regret to report that long term Sphere Entertainment Co. (NYSE:SPHR) shareholders have had that experience, with the share price dropping 43% in three years, versus a market return of about 37%. The last week also saw the share price slip down another 9.2%. But this could be related to the soft market, which is down about 4.8% in the same period.
If the past week is anything to go by, investor sentiment for Sphere Entertainment isn't positive, so let's see if there's a mismatch between fundamentals and the share price.
Check out our latest analysis for Sphere Entertainment
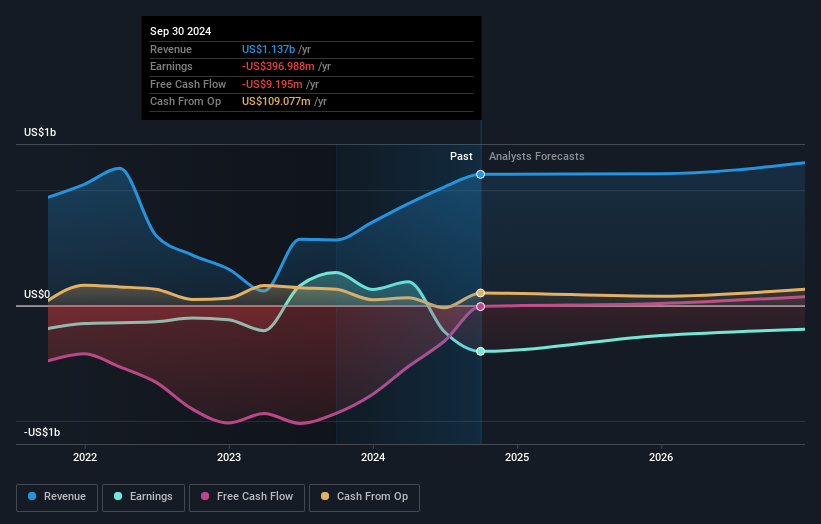
Because Sphere Entertainment made a loss in the last twelve months, we think the market is probably more focussed on revenue and revenue growth, at least for now. Generally speaking, companies without profits are expected to grow revenue every year, and at a good clip. That's because it's hard to be confident a company will be sustainable if revenue growth is negligible, and it never makes a profit.
In the last three years, Sphere Entertainment saw its revenue grow by 2.1% per year, compound. That's not a very high growth rate considering it doesn't make profits. Indeed, the stock dropped 13% over the last three years. If revenue growth accelerates, we might see the share price bounce. But the real upside for shareholders will be if the company can start generating profits.
The graphic below depicts how earnings and revenue have changed over time (unveil the exact values by clicking on the image).
We like that insiders have been buying shares in the last twelve months. Even so, future earnings will be far more important to whether current shareholders make money. So we recommend checking out this free report showing consensus forecasts
What About The Total Shareholder Return (TSR)?
We'd be remiss not to mention the difference between Sphere Entertainment's total shareholder return (TSR) and its share price return. The TSR attempts to capture the value of dividends (as if they were reinvested) as well as any spin-offs or discounted capital raisings offered to shareholders. We note that Sphere Entertainment's TSR, at 24% is higher than its share price return of -43%. When you consider it hasn't been paying a dividend, this data suggests shareholders have benefitted from a spin-off, or had the opportunity to acquire attractively priced shares in a discounted capital raising.
A Different Perspective
Over the last year, Sphere Entertainment shareholders took a loss of 0.7%. In contrast the market gained about 16%. Of course the long term matters more than the short term, and even great stocks will sometimes have a poor year. Fortunately the longer term story is brighter, with total returns averaging about 7% per year over three years. Sometimes when a good quality long term winner has a weak period, it's turns out to be an opportunity, but you really need to be sure that the quality is there. It's always interesting to track share price performance over the longer term. But to understand Sphere Entertainment better, we need to consider many other factors. To that end, you should be aware of the 1 warning sign we've spotted with Sphere Entertainment .
If you like to buy stocks alongside management, then you might just love this free list of companies. (Hint: most of them are flying under the radar).
Please note, the market returns quoted in this article reflect the market weighted average returns of stocks that currently trade on American exchanges.
If you're looking to trade Sphere Entertainment, open an account with the lowest-cost platform trusted by professionals, Interactive Brokers.
With clients in over 200 countries and territories, and access to 160 markets, IBKR lets you trade stocks, options, futures, forex, bonds and funds from a single integrated account.
Enjoy no hidden fees, no account minimums, and FX conversion rates as low as 0.03%, far better than what most brokers offer.
Sponsored ContentNew: Manage All Your Stock Portfolios in One Place
We've created the ultimate portfolio companion for stock investors, and it's free.
• Connect an unlimited number of Portfolios and see your total in one currency
• Be alerted to new Warning Signs or Risks via email or mobile
• Track the Fair Value of your stocks
Have feedback on this article? Concerned about the content? Get in touch with us directly. Alternatively, email editorial-team (at) simplywallst.com.
This article by Simply Wall St is general in nature. We provide commentary based on historical data and analyst forecasts only using an unbiased methodology and our articles are not intended to be financial advice. It does not constitute a recommendation to buy or sell any stock, and does not take account of your objectives, or your financial situation. We aim to bring you long-term focused analysis driven by fundamental data. Note that our analysis may not factor in the latest price-sensitive company announcements or qualitative material. Simply Wall St has no position in any stocks mentioned.
About NYSE:SPHR
Sphere Entertainment
Operates as a live entertainment and media company in the United States.
Good value with imperfect balance sheet.
Similar Companies
Market Insights

Community Narratives
