

The external fund manager backed by Berkshire Hathaway's Charlie Munger, Li Lu, makes no bones about it when he says 'The biggest investment risk is not the volatility of prices, but whether you will suffer a permanent loss of capital.' So it might be obvious that you need to consider debt, when you think about how risky any given stock is, because too much debt can sink a company. As with many other companies CF Industries Holdings, Inc. (NYSE:CF) makes use of debt. But the more important question is: how much risk is that debt creating?
What Risk Does Debt Bring?
Debt is a tool to help businesses grow, but if a business is incapable of paying off its lenders, then it exists at their mercy. If things get really bad, the lenders can take control of the business. While that is not too common, we often do see indebted companies permanently diluting shareholders because lenders force them to raise capital at a distressed price. Of course, plenty of companies use debt to fund growth, without any negative consequences. When we think about a company's use of debt, we first look at cash and debt together.
See our latest analysis for CF Industries Holdings
How Much Debt Does CF Industries Holdings Carry?
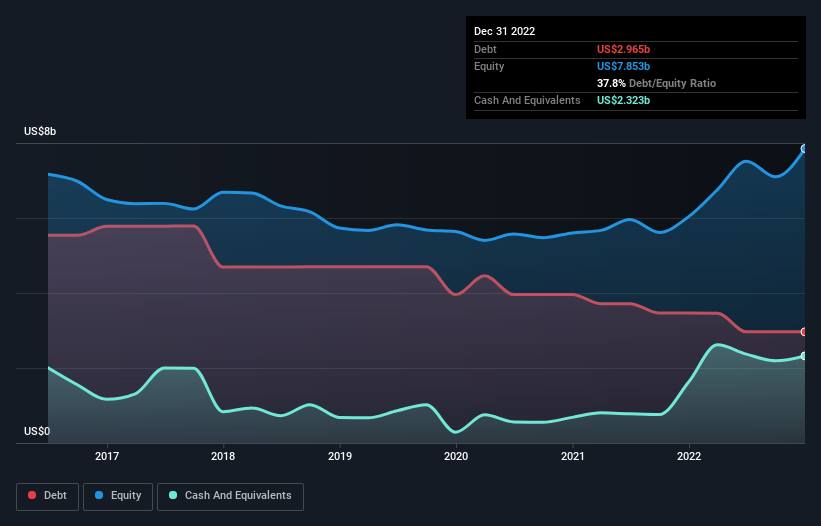
As you can see below, CF Industries Holdings had US$2.97b of debt at December 2022, down from US$3.47b a year prior. However, it also had US$2.32b in cash, and so its net debt is US$642.0m.
How Healthy Is CF Industries Holdings' Balance Sheet?
Zooming in on the latest balance sheet data, we can see that CF Industries Holdings had liabilities of US$995.0m due within 12 months and liabilities of US$4.47b due beyond that. Offsetting these obligations, it had cash of US$2.32b as well as receivables valued at US$582.0m due within 12 months. So it has liabilities totalling US$2.56b more than its cash and near-term receivables, combined.
Of course, CF Industries Holdings has a titanic market capitalization of US$14.0b, so these liabilities are probably manageable. Having said that, it's clear that we should continue to monitor its balance sheet, lest it change for the worse.
In order to size up a company's debt relative to its earnings, we calculate its net debt divided by its earnings before interest, tax, depreciation, and amortization (EBITDA) and its earnings before interest and tax (EBIT) divided by its interest expense (its interest cover). The advantage of this approach is that we take into account both the absolute quantum of debt (with net debt to EBITDA) and the actual interest expenses associated with that debt (with its interest cover ratio).
With debt at a measly 0.10 times EBITDA and EBIT covering interest a whopping 20.0 times, it's clear that CF Industries Holdings is not a desperate borrower. Indeed relative to its earnings its debt load seems light as a feather. Better yet, CF Industries Holdings grew its EBIT by 156% last year, which is an impressive improvement. That boost will make it even easier to pay down debt going forward. The balance sheet is clearly the area to focus on when you are analysing debt. But ultimately the future profitability of the business will decide if CF Industries Holdings can strengthen its balance sheet over time. So if you want to see what the professionals think, you might find this free report on analyst profit forecasts to be interesting.
Finally, while the tax-man may adore accounting profits, lenders only accept cold hard cash. So we always check how much of that EBIT is translated into free cash flow. Over the last three years, CF Industries Holdings recorded free cash flow worth a fulsome 80% of its EBIT, which is stronger than we'd usually expect. That positions it well to pay down debt if desirable to do so.
Our View
Happily, CF Industries Holdings's impressive interest cover implies it has the upper hand on its debt. And the good news does not stop there, as its conversion of EBIT to free cash flow also supports that impression! Considering this range of factors, it seems to us that CF Industries Holdings is quite prudent with its debt, and the risks seem well managed. So the balance sheet looks pretty healthy, to us. There's no doubt that we learn most about debt from the balance sheet. However, not all investment risk resides within the balance sheet - far from it. Be aware that CF Industries Holdings is showing 1 warning sign in our investment analysis , you should know about...
At the end of the day, it's often better to focus on companies that are free from net debt. You can access our special list of such companies (all with a track record of profit growth). It's free.
If you're looking to trade CF Industries Holdings, open an account with the lowest-cost platform trusted by professionals, Interactive Brokers.
With clients in over 200 countries and territories, and access to 160 markets, IBKR lets you trade stocks, options, futures, forex, bonds and funds from a single integrated account.
Enjoy no hidden fees, no account minimums, and FX conversion rates as low as 0.03%, far better than what most brokers offer.
Sponsored ContentNew: AI Stock Screener & Alerts
Our new AI Stock Screener scans the market every day to uncover opportunities.
• Dividend Powerhouses (3%+ Yield)
• Undervalued Small Caps with Insider Buying
• High growth Tech and AI Companies
Or build your own from over 50 metrics.
Have feedback on this article? Concerned about the content? Get in touch with us directly. Alternatively, email editorial-team (at) simplywallst.com.
This article by Simply Wall St is general in nature. We provide commentary based on historical data and analyst forecasts only using an unbiased methodology and our articles are not intended to be financial advice. It does not constitute a recommendation to buy or sell any stock, and does not take account of your objectives, or your financial situation. We aim to bring you long-term focused analysis driven by fundamental data. Note that our analysis may not factor in the latest price-sensitive company announcements or qualitative material. Simply Wall St has no position in any stocks mentioned.
About NYSE:CF
CF Industries Holdings
Engages in the manufacture and sale of hydrogen and nitrogen products for energy, fertilizer, emissions abatement, and other industrial activities in North America, Europe, and internationally.
Undervalued with excellent balance sheet and pays a dividend.

