
Advertisement
- United States
- /
- Metals and Mining
- /
- NasdaqCM:USAU
Here's Why We're A Bit Worried About U.S. Gold's (NASDAQ:USAU) Cash Burn Situation

There's no doubt that money can be made by owning shares of unprofitable businesses. For example, although software-as-a-service business Salesforce.com lost money for years while it grew recurring revenue, if you held shares since 2005, you'd have done very well indeed. Having said that, unprofitable companies are risky because they could potentially burn through all their cash and become distressed.
Given this risk, we thought we'd take a look at whether U.S. Gold (NASDAQ:USAU) shareholders should be worried about its cash burn. For the purposes of this article, cash burn is the annual rate at which an unprofitable company spends cash to fund its growth; its negative free cash flow. The first step is to compare its cash burn with its cash reserves, to give us its 'cash runway'.
View our latest analysis for U.S. Gold
How Long Is U.S. Gold's Cash Runway?
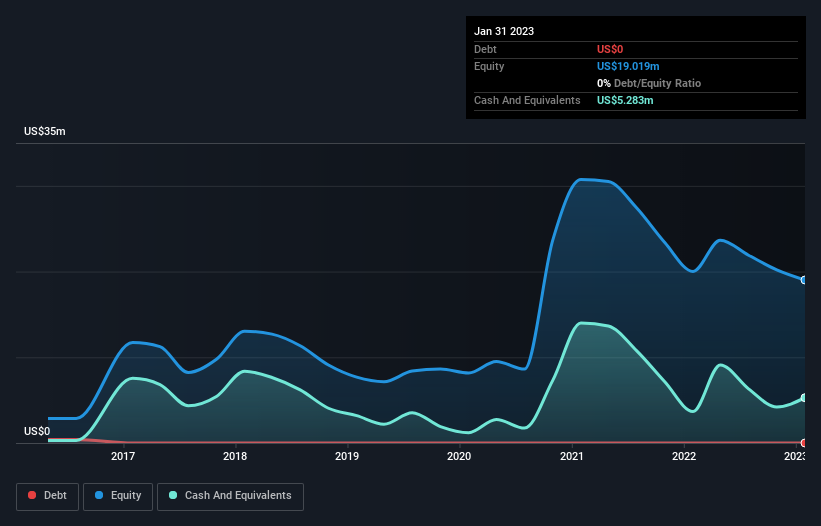
A company's cash runway is calculated by dividing its cash hoard by its cash burn. When U.S. Gold last reported its balance sheet in January 2023, it had zero debt and cash worth US$5.3m. Looking at the last year, the company burnt through US$9.4m. That means it had a cash runway of around 7 months as of January 2023. To be frank, this kind of short runway puts us on edge, as it indicates the company must reduce its cash burn significantly, or else raise cash imminently. Importantly, if we extrapolate recent cash burn trends, the cash runway would be a lot longer. You can see how its cash balance has changed over time in the image below.
How Is U.S. Gold's Cash Burn Changing Over Time?
Because U.S. Gold isn't currently generating revenue, we consider it an early-stage business. So while we can't look to sales to understand growth, we can look at how the cash burn is changing to understand how expenditure is trending over time. As it happens, the company's cash burn reduced by 23% over the last year, which suggests that management are mindful of the possibility of running out of cash. While the past is always worth studying, it is the future that matters most of all. For that reason, it makes a lot of sense to take a look at our analyst forecasts for the company.
How Easily Can U.S. Gold Raise Cash?
Even though it has reduced its cash burn recently, shareholders should still consider how easy it would be for U.S. Gold to raise more cash in the future. Generally speaking, a listed business can raise new cash through issuing shares or taking on debt. Commonly, a business will sell new shares in itself to raise cash and drive growth. By looking at a company's cash burn relative to its market capitalisation, we gain insight on how much shareholders would be diluted if the company needed to raise enough cash to cover another year's cash burn.
U.S. Gold's cash burn of US$9.4m is about 24% of its US$39m market capitalisation. That's fairly notable cash burn, so if the company had to sell shares to cover the cost of another year's operations, shareholders would suffer some costly dilution.
How Risky Is U.S. Gold's Cash Burn Situation?
On this analysis of U.S. Gold's cash burn, we think its cash burn reduction was reassuring, while its cash runway has us a bit worried. After looking at that range of measures, we think shareholders should be extremely attentive to how the company is using its cash, as the cash burn makes us uncomfortable. Separately, we looked at different risks affecting the company and spotted 5 warning signs for U.S. Gold (of which 2 are a bit concerning!) you should know about.
Of course, you might find a fantastic investment by looking elsewhere. So take a peek at this free list of companies insiders are buying, and this list of stocks growth stocks (according to analyst forecasts)
New: AI Stock Screener & Alerts
Our new AI Stock Screener scans the market every day to uncover opportunities.
• Dividend Powerhouses (3%+ Yield)
• Undervalued Small Caps with Insider Buying
• High growth Tech and AI Companies
Or build your own from over 50 metrics.
Have feedback on this article? Concerned about the content? Get in touch with us directly. Alternatively, email editorial-team (at) simplywallst.com.
This article by Simply Wall St is general in nature. We provide commentary based on historical data and analyst forecasts only using an unbiased methodology and our articles are not intended to be financial advice. It does not constitute a recommendation to buy or sell any stock, and does not take account of your objectives, or your financial situation. We aim to bring you long-term focused analysis driven by fundamental data. Note that our analysis may not factor in the latest price-sensitive company announcements or qualitative material. Simply Wall St has no position in any stocks mentioned.
About NasdaqCM:USAU
U.S. Gold
Engages in the exploration and development of gold and precious metals primarily in the United States.
Flawless balance sheet low.
Market Insights

Advertisement
Community Narratives
Nike's Direct-to-Consumer Focus Will Drive Future Growth
Fair Value US$87.90|16.6% undervalued
UN
Community Contributor
Novo Nordisk will dominate GLP-1 market with Ozempic and Wegovy growth
Fair Value US$89.59|9.6% undervalued
BE
Community Contributor
Rheinmetall could get 20-25% of EU-NATO 3%-GDP defence spending
Fair Value €7.57k|80.9% undervalued
NO
Community Contributor