Advertisement
- United States
- /
- Metals and Mining
- /
- NasdaqGS:RGLD
Does Royal Gold’s 50% Rally Signal More Room to Run in 2025?

Simply Wall St
Reviewed by Bailey Pemberton
Thinking about what to do with Royal Gold stock? You are not alone. Investors have watched this precious metals royalty and streaming company defy expectations with a stellar return of more than 50% so far this year. That impressive rally comes on top of gains of 38.7% over the last twelve months and an incredible 131% over three years. Clearly, something is working in Royal Gold’s favor.
Over the past month, shares climbed 3.5% even as gold prices moved sideways and market sentiment wobbled. Granted, there was a dip of 1.5% in the last week, likely tied to some profit-taking after a heady run. However, the upside momentum and willingness of investors to pay up suggest a growing sense that Royal Gold’s risk profile is shifting in a positive direction.
Is the stock still a good value after such a run? Based on six standard valuation checks, Royal Gold gets a value score of 3, which means it is undervalued on three fronts and neutral or overvalued on the others. That can be a good starting point for a deeper dive.
Of course, not every valuation method tells the whole story. Let’s walk through each approach, see how Royal Gold stacks up, and at the end, learn about a better way to look at valuation that could help inform investment decisions.
Why Royal Gold is lagging behind its peers
Approach 1: Royal Gold Discounted Cash Flow (DCF) Analysis
The Discounted Cash Flow (DCF) model is a valuation approach that estimates a company's intrinsic value by forecasting its future cash flows and discounting them back to today’s value. For Royal Gold, this means projecting how much cash the business is expected to generate in coming years and translating that into a present-day valuation in US dollars.
Currently, Royal Gold’s last twelve months Free Cash Flow (FCF) is $107.7 Million. Analysts provide cash flow estimates for the next few years, projecting Free Cash Flow to reach $1.06 Billion by the end of 2029. After that, additional growth is extrapolated based on trends analyzed by Simply Wall St. This stepwise forecast, known as the 2 Stage Free Cash Flow to Equity model, relies on a blend of expert estimates and data-driven projections for the later years.
Based on these projections and discounting all future cash flows to their present value, the DCF valuation estimates Royal Gold’s intrinsic value at $315.34 per share. This suggests the stock is trading at a 35.9% discount to its fair value, which may indicate a significant margin of safety for potential investors.
Result: UNDERVALUED
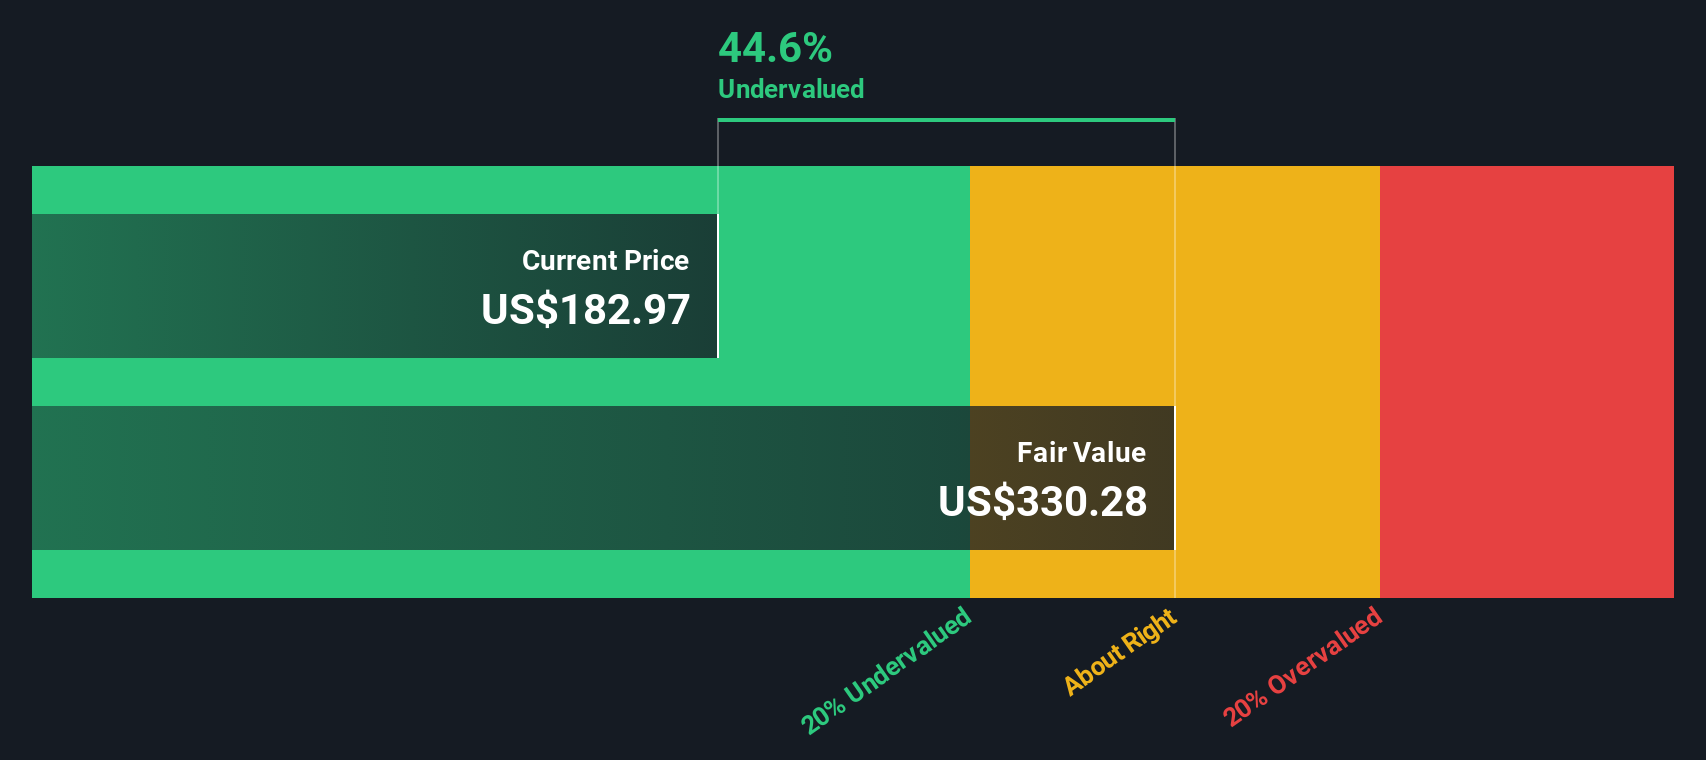
Our Discounted Cash Flow (DCF) analysis suggests Royal Gold is undervalued by 35.9%. Track this in your watchlist or portfolio, or discover more undervalued stocks.
Approach 2: Royal Gold Price vs Earnings
For profitable companies like Royal Gold, the price-to-earnings (PE) ratio is a widely used valuation measure. It compares a company's share price to its earnings per share, providing a snapshot of how much investors are willing to pay for each dollar of profit. Companies with higher growth prospects or less risk often deserve a higher PE, while those with stagnating profits or greater uncertainty tend to trade at a lower multiple.
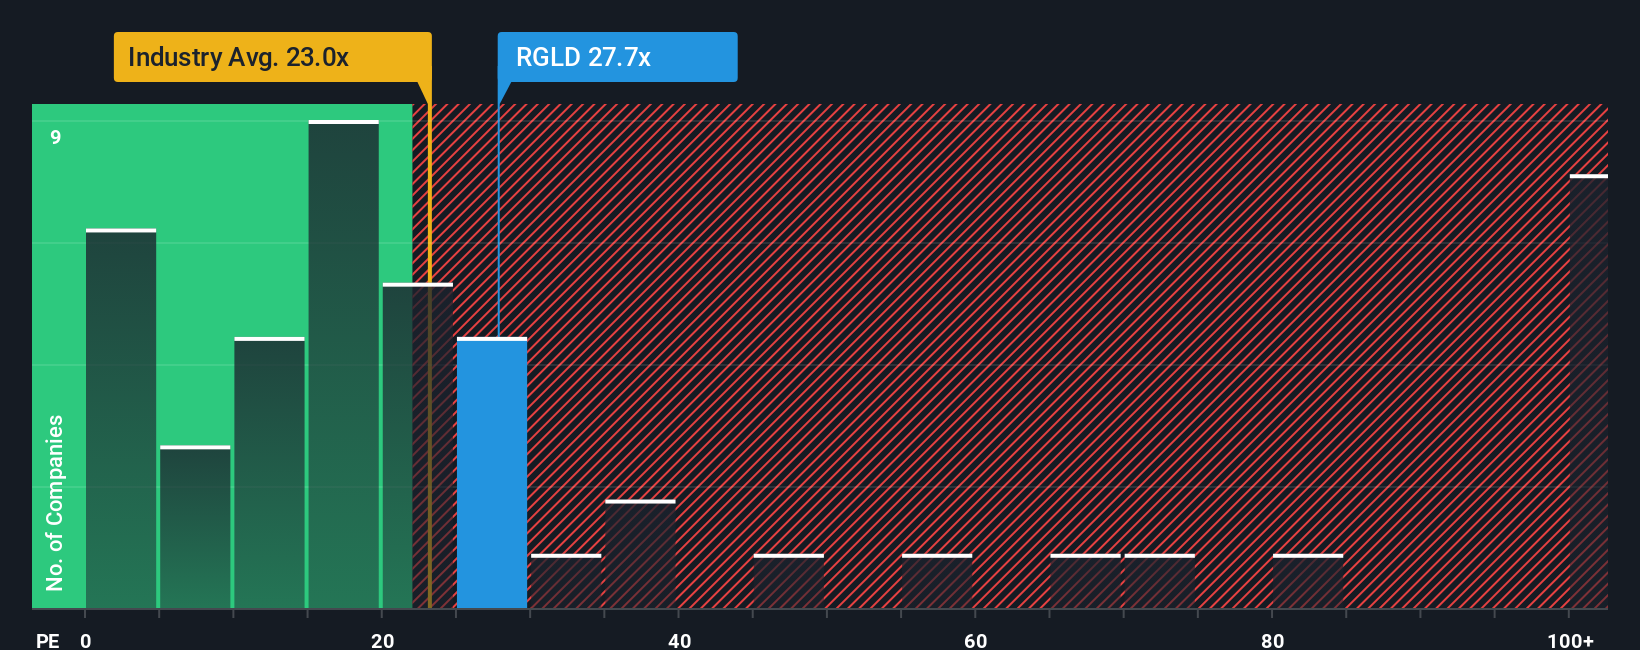
Royal Gold currently trades at a PE ratio of 29.6x, which is a bit higher than the industry average of 25.5x and below the peer average of 32.3x. These benchmarks set the context, but each company’s ideal PE is unique based on its future growth, profitability, industry dynamics, and risk factors.
To account for these nuances, Simply Wall St calculates a “Fair Ratio,” representing the multiple that makes sense for Royal Gold’s specific situation, taking into consideration its earnings growth outlook, profit margins, market cap, industry, and risk profile. For Royal Gold, the Fair Ratio is 22.5x, notably lower than its current level. This suggests that, although Royal Gold is seen favorably in the market relative to peers, it may be trading at a premium to what its fundamentals justify using this framework.
Result: OVERVALUED
PE ratios tell one story, but what if the real opportunity lies elsewhere? Discover companies where insiders are betting big on explosive growth.
Upgrade Your Decision Making: Choose your Royal Gold Narrative
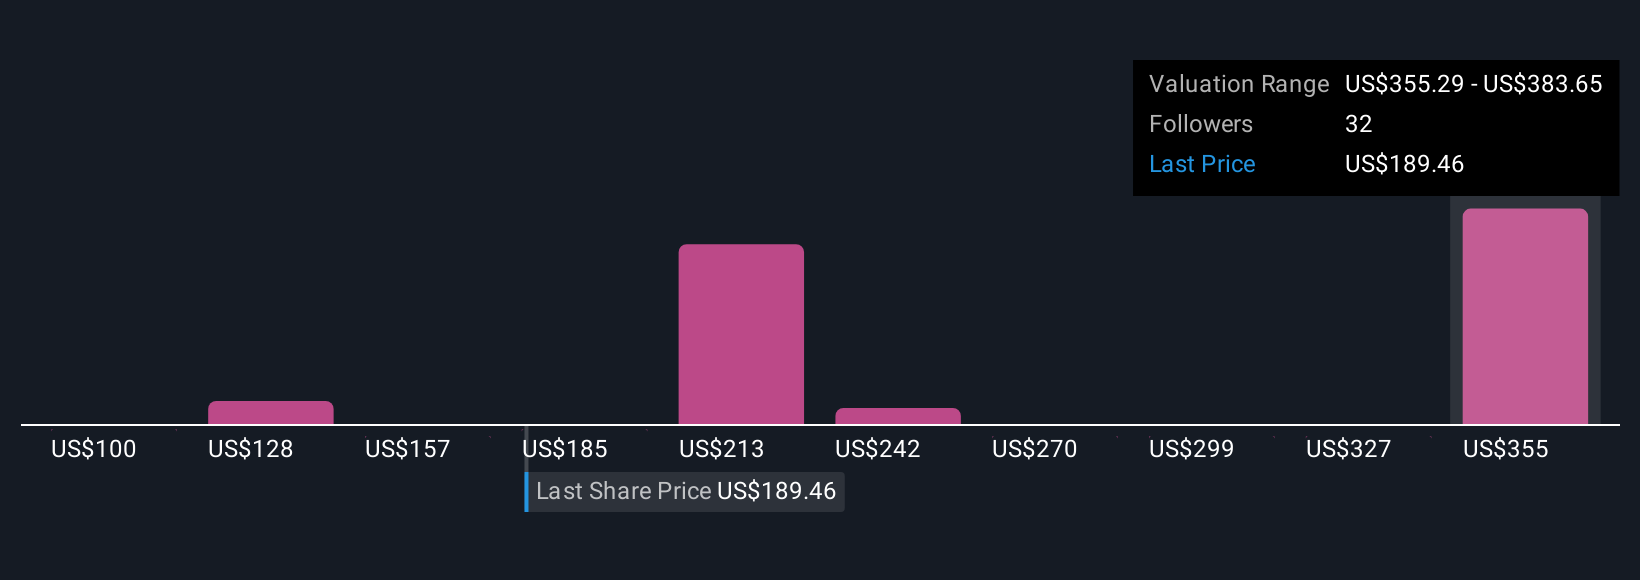
Earlier we mentioned there is an even better way to understand valuation, so let’s introduce Narratives. A Narrative is more than just numbers; it is your story and perspective about a company, connecting what you believe about Royal Gold’s future (such as revenue growth, margins, and fair value) to a clear financial forecast and a rational price estimate.
Narratives empower you to make buy or sell decisions by charting a path from your assumptions through a fair value and comparing it to today’s price, making your investing intuition practical and actionable. Narratives are simple to use and available on Simply Wall St’s Community page, trusted by millions of investors. They dynamically update as new facts emerge, such as fresh earnings or major news, keeping your viewpoint relevant and informed.
For example, two Royal Gold investors might build different Narratives: one sees aggressive growth from diversification and project investments, resulting in a higher fair value estimate, while another, more cautious about risk from gold exposure and new acquisitions, assigns a lower fair value. Narratives help you turn your understanding and expectations into confident decisions, adapting as the Royal Gold story unfolds.
Do you think there's more to the story for Royal Gold? Create your own Narrative to let the Community know!
This article by Simply Wall St is general in nature. We provide commentary based on historical data and analyst forecasts only using an unbiased methodology and our articles are not intended to be financial advice. It does not constitute a recommendation to buy or sell any stock, and does not take account of your objectives, or your financial situation. We aim to bring you long-term focused analysis driven by fundamental data. Note that our analysis may not factor in the latest price-sensitive company announcements or qualitative material. Simply Wall St has no position in any stocks mentioned.
New: AI Stock Screener & Alerts
Our new AI Stock Screener scans the market every day to uncover opportunities.
• Dividend Powerhouses (3%+ Yield)
• Undervalued Small Caps with Insider Buying
• High growth Tech and AI Companies
Or build your own from over 50 metrics.
Have feedback on this article? Concerned about the content? Get in touch with us directly. Alternatively, email editorial-team@simplywallst.com
About NasdaqGS:RGLD
Royal Gold
Acquires and manages precious metal streams, royalties, and related interests.
Flawless balance sheet with solid track record and pays a dividend.
Similar Companies
Market Insights

Advertisement
Community Narratives
A formidable player in AI and enterprise computing.
Fair Value US$210.00|11.7% overvalued
CO
Community Contributor
IREN's Bold Moves in Sustainable Bitcoin Mining & AI Data Centers
Fair Value US$89.00|23.6% undervalued
BL
Community Contributor
Cooling the Champions: The Aussie Tech Behind F1's Victories
Fair Value AU$12.40|37.6% undervalued
TR
Community Contributor