- United States
- /
- Metals and Mining
- /
- NasdaqGS:METC
Ramaco Resources (NASDAQ:METC) jumps 15% this week, though earnings growth is still tracking behind five-year shareholder returns


It hasn't been the best quarter for Ramaco Resources, Inc. (NASDAQ:METC) shareholders, since the share price has fallen 17% in that time. But that scarcely detracts from the really solid long term returns generated by the company over five years. Indeed, the share price is up an impressive 226% in that time. So while it's never fun to see a share price fall, it's important to look at a longer time horizon. The more important question is whether the stock is too cheap or too expensive today.
Since the stock has added US$82m to its market cap in the past week alone, let's see if underlying performance has been driving long-term returns.
Check out our latest analysis for Ramaco Resources
In his essay The Superinvestors of Graham-and-Doddsville Warren Buffett described how share prices do not always rationally reflect the value of a business. One imperfect but simple way to consider how the market perception of a company has shifted is to compare the change in the earnings per share (EPS) with the share price movement.
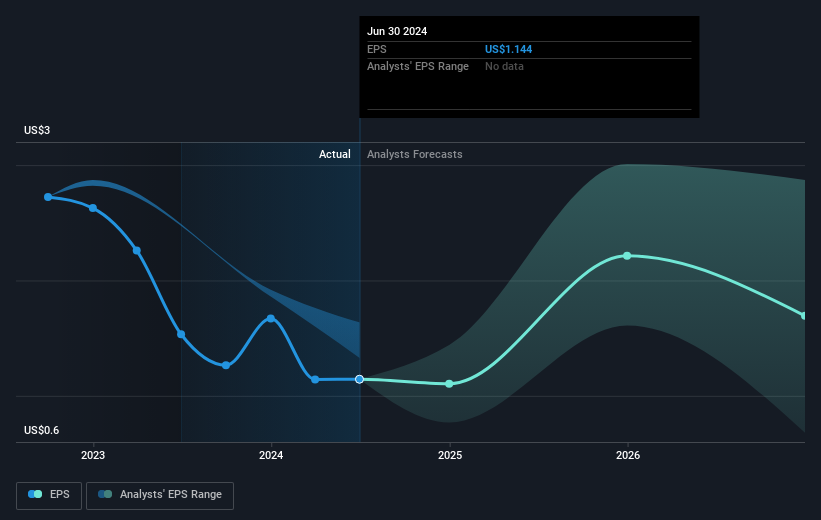
During five years of share price growth, Ramaco Resources achieved compound earnings per share (EPS) growth of 8.8% per year. This EPS growth is slower than the share price growth of 27% per year, over the same period. This suggests that market participants hold the company in higher regard, these days. And that's hardly shocking given the track record of growth.
The graphic below depicts how EPS has changed over time (unveil the exact values by clicking on the image).
We consider it positive that insiders have made significant purchases in the last year. Even so, future earnings will be far more important to whether current shareholders make money. Before buying or selling a stock, we always recommend a close examination of historic growth trends, available here..
What About Dividends?
As well as measuring the share price return, investors should also consider the total shareholder return (TSR). The TSR is a return calculation that accounts for the value of cash dividends (assuming that any dividend received was reinvested) and the calculated value of any discounted capital raisings and spin-offs. Arguably, the TSR gives a more comprehensive picture of the return generated by a stock. In the case of Ramaco Resources, it has a TSR of 348% for the last 5 years. That exceeds its share price return that we previously mentioned. This is largely a result of its dividend payments!
A Different Perspective
Ramaco Resources shareholders are up 20% for the year (even including dividends). But that return falls short of the market. On the bright side, the longer term returns (running at about 35% a year, over half a decade) look better. It's quite possible the business continues to execute with prowess, even as the share price gains are slowing. It's always interesting to track share price performance over the longer term. But to understand Ramaco Resources better, we need to consider many other factors. Case in point: We've spotted 2 warning signs for Ramaco Resources you should be aware of.
Ramaco Resources is not the only stock insiders are buying. So take a peek at this free list of small cap companies at attractive valuations which insiders have been buying.
Please note, the market returns quoted in this article reflect the market weighted average returns of stocks that currently trade on American exchanges.
New: AI Stock Screener & Alerts
Our new AI Stock Screener scans the market every day to uncover opportunities.
• Dividend Powerhouses (3%+ Yield)
• Undervalued Small Caps with Insider Buying
• High growth Tech and AI Companies
Or build your own from over 50 metrics.
Have feedback on this article? Concerned about the content? Get in touch with us directly. Alternatively, email editorial-team (at) simplywallst.com.
This article by Simply Wall St is general in nature. We provide commentary based on historical data and analyst forecasts only using an unbiased methodology and our articles are not intended to be financial advice. It does not constitute a recommendation to buy or sell any stock, and does not take account of your objectives, or your financial situation. We aim to bring you long-term focused analysis driven by fundamental data. Note that our analysis may not factor in the latest price-sensitive company announcements or qualitative material. Simply Wall St has no position in any stocks mentioned.
About NasdaqGS:METC
Ramaco Resources
Engages in the development, operation, and sale of metallurgical coal.
Undervalued with reasonable growth potential and pays a dividend.

