- United States
- /
- Insurance
- /
- NYSE:PRU
Prudential Financial (NYSE:PRU) shareholders notch a 11% CAGR over 5 years, yet earnings have been shrinking


If you buy and hold a stock for many years, you'd hope to be making a profit. Better yet, you'd like to see the share price move up more than the market average. Unfortunately for shareholders, while the Prudential Financial, Inc. (NYSE:PRU) share price is up 33% in the last five years, that's less than the market return. Over the last twelve months the stock price has risen a very respectable 20%.
The past week has proven to be lucrative for Prudential Financial investors, so let's see if fundamentals drove the company's five-year performance.
View our latest analysis for Prudential Financial
In his essay The Superinvestors of Graham-and-Doddsville Warren Buffett described how share prices do not always rationally reflect the value of a business. One flawed but reasonable way to assess how sentiment around a company has changed is to compare the earnings per share (EPS) with the share price.
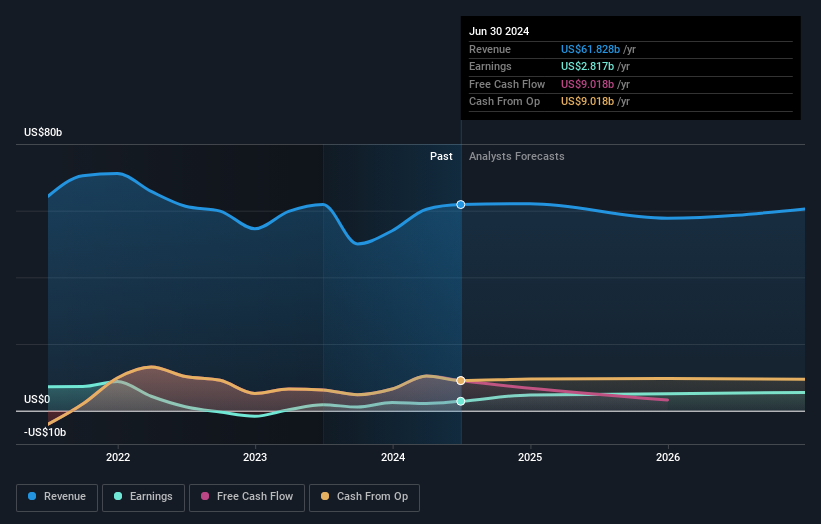
During five years of share price growth, Prudential Financial actually saw its EPS drop 4.7% per year.
So it's hard to argue that the earnings per share are the best metric to judge the company, as it may not be optimized for profits at this point. Therefore, it's worth taking a look at other metrics to try to understand the share price movements.
In fact, the dividend has increased over time, which is a positive. Maybe dividend investors have helped support the share price.
The graphic below depicts how earnings and revenue have changed over time (unveil the exact values by clicking on the image).
We know that Prudential Financial has improved its bottom line lately, but what does the future have in store? If you are thinking of buying or selling Prudential Financial stock, you should check out this free report showing analyst profit forecasts.
What About Dividends?
When looking at investment returns, it is important to consider the difference between total shareholder return (TSR) and share price return. The TSR is a return calculation that accounts for the value of cash dividends (assuming that any dividend received was reinvested) and the calculated value of any discounted capital raisings and spin-offs. Arguably, the TSR gives a more comprehensive picture of the return generated by a stock. As it happens, Prudential Financial's TSR for the last 5 years was 71%, which exceeds the share price return mentioned earlier. This is largely a result of its dividend payments!
A Different Perspective
Prudential Financial shareholders have received returns of 26% over twelve months (even including dividends), which isn't far from the general market return. That gain looks pretty satisfying, and it is even better than the five-year TSR of 11% per year. It is possible that management foresight will bring growth well into the future, even if the share price slows down. Before spending more time on Prudential Financial it might be wise to click here to see if insiders have been buying or selling shares.
If you are like me, then you will not want to miss this free list of undervalued small caps that insiders are buying.
Please note, the market returns quoted in this article reflect the market weighted average returns of stocks that currently trade on American exchanges.
New: Manage All Your Stock Portfolios in One Place
We've created the ultimate portfolio companion for stock investors, and it's free.
• Connect an unlimited number of Portfolios and see your total in one currency
• Be alerted to new Warning Signs or Risks via email or mobile
• Track the Fair Value of your stocks
Have feedback on this article? Concerned about the content? Get in touch with us directly. Alternatively, email editorial-team (at) simplywallst.com.
This article by Simply Wall St is general in nature. We provide commentary based on historical data and analyst forecasts only using an unbiased methodology and our articles are not intended to be financial advice. It does not constitute a recommendation to buy or sell any stock, and does not take account of your objectives, or your financial situation. We aim to bring you long-term focused analysis driven by fundamental data. Note that our analysis may not factor in the latest price-sensitive company announcements or qualitative material. Simply Wall St has no position in any stocks mentioned.
About NYSE:PRU
Prudential Financial
Provides insurance, investment management, and other financial products and services in the United States and internationally.
Undervalued established dividend payer.

