Mercury General (MCY) has delivered a 3% gain over the past month and is up 21% since the start of the year. Investors keeping an eye on insurance stocks may be interested in how it has been navigating the current market.
Mercury General's share price has seen a strong run in 2024, logging a 21.9% gain so far this year and a recent 3% uptick over the past month, though it did take a breather this week. That momentum reflects optimism after a tough cycle for the insurance sector, and the company’s impressive 25.6% total shareholder return over the past year, as well as even more striking three- and five-year figures, shows that those who stuck with MCY have been well rewarded.
But with shares now just under 25% below average analyst price targets, the key question for investors is whether Mercury General remains undervalued or if the company’s solid returns mean future growth is already factored in.
Advertisement
Most Popular Narrative: 19.9% Undervalued
Mercury General’s most closely followed valuation narrative sets its fair value at $100, notably above the last close price of $80.14. This is fueling interest, especially as the market tries to determine if these targets are achievable given the company’s recent run of returns.
The company's core underlying business, excluding catastrophe losses, is strong with favorable underlying combined ratios in their personal auto and homeowners business. This suggests potential for improvement in future earnings stability and net margins.
Want to know what’s driving this bullish target? The narrative banks on robust operational strength and a key assumption about a steadier profit engine. Find out which bullish projections could shake up expectations. There is a fascinating story behind these numbers.
However, potential setbacks from costly wildfire losses or rising reinsurance expenses could reduce optimism regarding Mercury General’s future earnings stability.
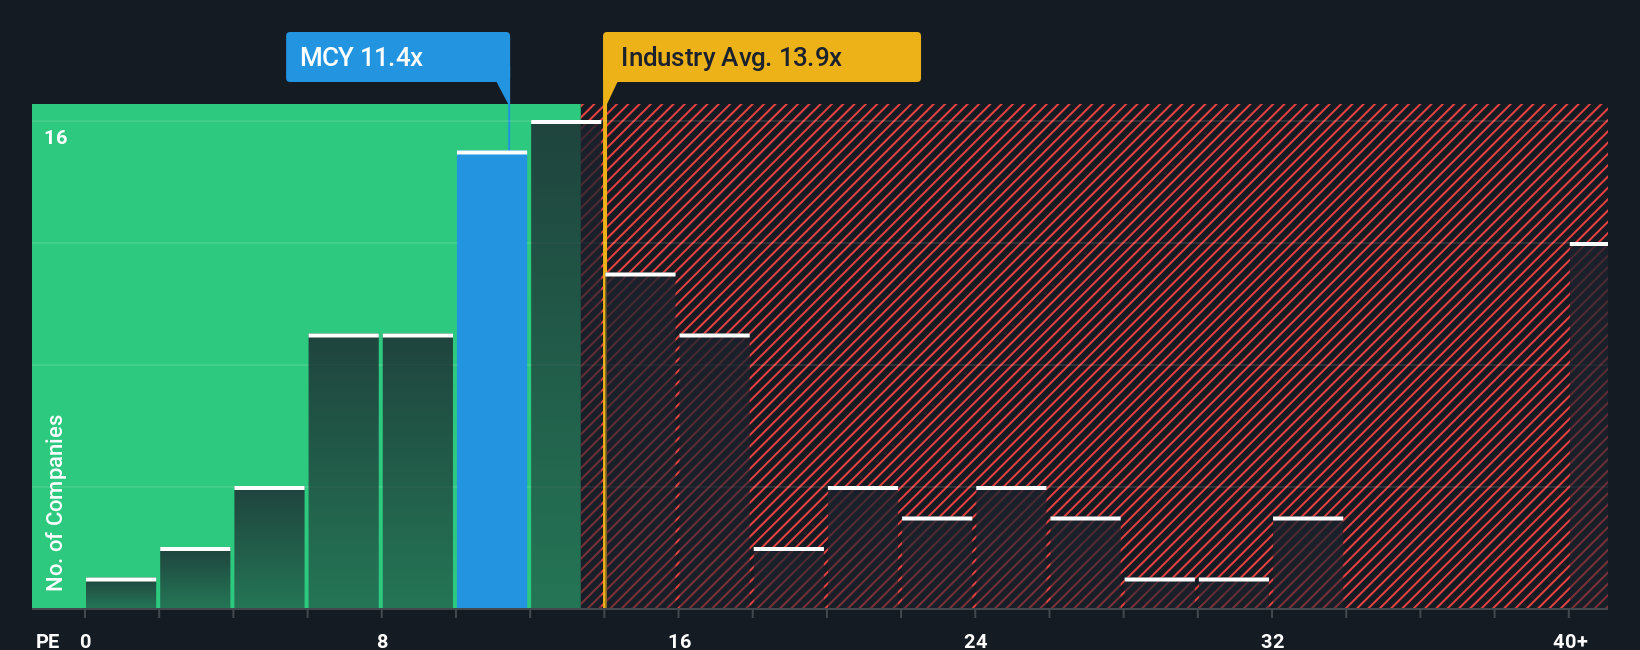
Looking from a price-to-earnings angle, Mercury General trades at 11.4x, which is much lower than peers at 15.8x, the US Insurance industry at 13.9x, and the fair ratio of 13.1x. This gap suggests the market sees extra risks or lacks confidence in the current outlook. Could sentiment shift or is caution justified?
Simply Wall St performs a discounted cash flow (DCF) on every stock in the world every day (check out Mercury General for example). We show the entire calculation in full. You can track the result in your watchlist or portfolio and be alerted when this changes, or use our stock screener to discover undervalued stocks based on their cash flows. If you save a screener we even alert you when new companies match - so you never miss a potential opportunity.
Build Your Own Mercury General Narrative
If you have a different perspective or want to dive deeper into the numbers, you can shape your own Mercury General narrative in just a few minutes. Do it your way
A great starting point for your Mercury General research is our analysis highlighting 4 key rewards and 1 important warning sign that could impact your investment decision.
Looking for more investment ideas?
Smart investors keep ahead of the curve. Make sure you don’t miss out on tomorrow’s winners using the Simply Wall Street Screener, where opportunities are just a click away.
This article by Simply Wall St is general in nature. We provide commentary based on historical data
and analyst forecasts only using an unbiased methodology and our articles are not intended to be financial advice. It does not constitute a recommendation to buy or sell any stock, and does not take account of your objectives, or your
financial situation. We aim to bring you long-term focused analysis driven by fundamental data.
Note that our analysis may not factor in the latest price-sensitive company announcements or qualitative material.
Simply Wall St has no position in any stocks mentioned.
New: Manage All Your Stock Portfolios in One Place
We've created the ultimate portfolio companion for stock investors, and it's free.
• Connect an unlimited number of Portfolios and see your total in one currency • Be alerted to new Warning Signs or Risks via email or mobile • Track the Fair Value of your stocks