- United States
- /
- Healthcare Services
- /
- NYSE:USPH
A Look At The Fair Value Of U.S. Physical Therapy, Inc. (NYSE:USPH)


Key Insights
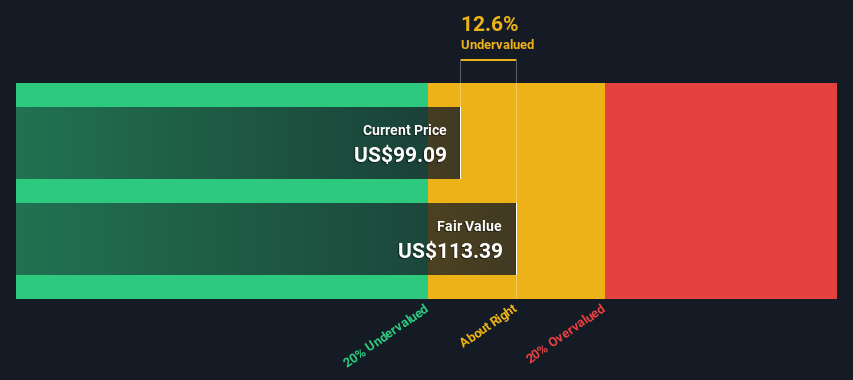
- Using the 2 Stage Free Cash Flow to Equity, U.S. Physical Therapy fair value estimate is US$113
- U.S. Physical Therapy's US$99.09 share price indicates it is trading at similar levels as its fair value estimate
- Our fair value estimate is 5.0% lower than U.S. Physical Therapy's analyst price target of US$119
Today we'll do a simple run through of a valuation method used to estimate the attractiveness of U.S. Physical Therapy, Inc. (NYSE:USPH) as an investment opportunity by projecting its future cash flows and then discounting them to today's value. The Discounted Cash Flow (DCF) model is the tool we will apply to do this. It may sound complicated, but actually it is quite simple!
Remember though, that there are many ways to estimate a company's value, and a DCF is just one method. For those who are keen learners of equity analysis, the Simply Wall St analysis model here may be something of interest to you.
View our latest analysis for U.S. Physical Therapy
Is U.S. Physical Therapy Fairly Valued?
We're using the 2-stage growth model, which simply means we take in account two stages of company's growth. In the initial period the company may have a higher growth rate and the second stage is usually assumed to have a stable growth rate. To start off with, we need to estimate the next ten years of cash flows. Where possible we use analyst estimates, but when these aren't available we extrapolate the previous free cash flow (FCF) from the last estimate or reported value. We assume companies with shrinking free cash flow will slow their rate of shrinkage, and that companies with growing free cash flow will see their growth rate slow, over this period. We do this to reflect that growth tends to slow more in the early years than it does in later years.
Generally we assume that a dollar today is more valuable than a dollar in the future, so we need to discount the sum of these future cash flows to arrive at a present value estimate:
10-year free cash flow (FCF) forecast
| 2024 | 2025 | 2026 | 2027 | 2028 | 2029 | 2030 | 2031 | 2032 | 2033 | |
| Levered FCF ($, Millions) | US$66.2m | US$66.3m | US$70.0m | US$69.9m | US$70.4m | US$71.2m | US$72.2m | US$73.5m | US$74.8m | US$76.3m |
| Growth Rate Estimate Source | Analyst x3 | Analyst x3 | Analyst x1 | Est @ -0.09% | Est @ 0.62% | Est @ 1.12% | Est @ 1.47% | Est @ 1.72% | Est @ 1.89% | Est @ 2.01% |
| Present Value ($, Millions) Discounted @ 6.0% | US$62.5 | US$59.0 | US$58.8 | US$55.5 | US$52.7 | US$50.3 | US$48.1 | US$46.2 | US$44.4 | US$42.8 |
("Est" = FCF growth rate estimated by Simply Wall St)
Present Value of 10-year Cash Flow (PVCF) = US$520m
We now need to calculate the Terminal Value, which accounts for all the future cash flows after this ten year period. The Gordon Growth formula is used to calculate Terminal Value at a future annual growth rate equal to the 5-year average of the 10-year government bond yield of 2.3%. We discount the terminal cash flows to today's value at a cost of equity of 6.0%.
Terminal Value (TV)= FCF2033 × (1 + g) ÷ (r – g) = US$76m× (1 + 2.3%) ÷ (6.0%– 2.3%) = US$2.1b
Present Value of Terminal Value (PVTV)= TV / (1 + r)10= US$2.1b÷ ( 1 + 6.0%)10= US$1.2b
The total value, or equity value, is then the sum of the present value of the future cash flows, which in this case is US$1.7b. To get the intrinsic value per share, we divide this by the total number of shares outstanding. Compared to the current share price of US$99.1, the company appears about fair value at a 13% discount to where the stock price trades currently. Valuations are imprecise instruments though, rather like a telescope - move a few degrees and end up in a different galaxy. Do keep this in mind.
Important Assumptions
We would point out that the most important inputs to a discounted cash flow are the discount rate and of course the actual cash flows. Part of investing is coming up with your own evaluation of a company's future performance, so try the calculation yourself and check your own assumptions. The DCF also does not consider the possible cyclicality of an industry, or a company's future capital requirements, so it does not give a full picture of a company's potential performance. Given that we are looking at U.S. Physical Therapy as potential shareholders, the cost of equity is used as the discount rate, rather than the cost of capital (or weighted average cost of capital, WACC) which accounts for debt. In this calculation we've used 6.0%, which is based on a levered beta of 0.800. Beta is a measure of a stock's volatility, compared to the market as a whole. We get our beta from the industry average beta of globally comparable companies, with an imposed limit between 0.8 and 2.0, which is a reasonable range for a stable business.
SWOT Analysis for U.S. Physical Therapy
- Debt is not viewed as a risk.
- Earnings declined over the past year.
- Dividend is low compared to the top 25% of dividend payers in the Healthcare market.
- Shareholders have been diluted in the past year.
- Annual earnings are forecast to grow faster than the American market.
- Current share price is below our estimate of fair value.
- Dividends are not covered by earnings.
- Annual revenue is forecast to grow slower than the American market.
Moving On:
Whilst important, the DCF calculation is only one of many factors that you need to assess for a company. It's not possible to obtain a foolproof valuation with a DCF model. Rather it should be seen as a guide to "what assumptions need to be true for this stock to be under/overvalued?" For instance, if the terminal value growth rate is adjusted slightly, it can dramatically alter the overall result. For U.S. Physical Therapy, there are three essential factors you should further examine:
- Risks: You should be aware of the 5 warning signs for U.S. Physical Therapy we've uncovered before considering an investment in the company.
- Management:Have insiders been ramping up their shares to take advantage of the market's sentiment for USPH's future outlook? Check out our management and board analysis with insights on CEO compensation and governance factors.
- Other Solid Businesses: Low debt, high returns on equity and good past performance are fundamental to a strong business. Why not explore our interactive list of stocks with solid business fundamentals to see if there are other companies you may not have considered!
PS. Simply Wall St updates its DCF calculation for every American stock every day, so if you want to find the intrinsic value of any other stock just search here.
New: AI Stock Screener & Alerts
Our new AI Stock Screener scans the market every day to uncover opportunities.
• Dividend Powerhouses (3%+ Yield)
• Undervalued Small Caps with Insider Buying
• High growth Tech and AI Companies
Or build your own from over 50 metrics.
Have feedback on this article? Concerned about the content? Get in touch with us directly. Alternatively, email editorial-team (at) simplywallst.com.
This article by Simply Wall St is general in nature. We provide commentary based on historical data and analyst forecasts only using an unbiased methodology and our articles are not intended to be financial advice. It does not constitute a recommendation to buy or sell any stock, and does not take account of your objectives, or your financial situation. We aim to bring you long-term focused analysis driven by fundamental data. Note that our analysis may not factor in the latest price-sensitive company announcements or qualitative material. Simply Wall St has no position in any stocks mentioned.
About NYSE:USPH
U.S. Physical Therapy
Operates and manages outpatient physical therapy clinics.
Excellent balance sheet with proven track record and pays a dividend.
Similar Companies
Market Insights

Community Narratives


