
Advertisement
- United States
- /
- Food
- /
- NYSE:TR
Calculating The Intrinsic Value Of Tootsie Roll Industries, Inc. (NYSE:TR)
Key Insights
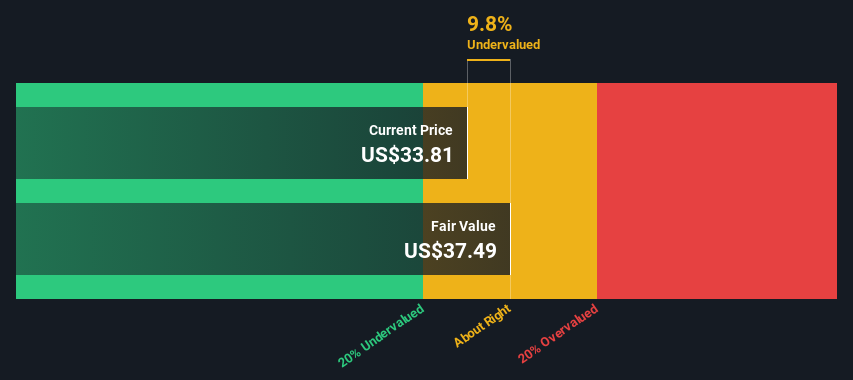
- Tootsie Roll Industries' estimated fair value is US$37.49 based on 2 Stage Free Cash Flow to Equity
- Current share price of US$33.81 suggests Tootsie Roll Industries is potentially trading close to its fair value
- When compared to theindustry average discount to fair value of 9.9%, Tootsie Roll Industries' competitors seem to be trading at a greater discount
Today we will run through one way of estimating the intrinsic value of Tootsie Roll Industries, Inc. (NYSE:TR) by projecting its future cash flows and then discounting them to today's value. This will be done using the Discounted Cash Flow (DCF) model. Don't get put off by the jargon, the math behind it is actually quite straightforward.
We generally believe that a company's value is the present value of all of the cash it will generate in the future. However, a DCF is just one valuation metric among many, and it is not without flaws. For those who are keen learners of equity analysis, the Simply Wall St analysis model here may be something of interest to you.
We check all companies for important risks. See what we found for Tootsie Roll Industries in our free report.Is Tootsie Roll Industries Fairly Valued?
We're using the 2-stage growth model, which simply means we take in account two stages of company's growth. In the initial period the company may have a higher growth rate and the second stage is usually assumed to have a stable growth rate. To start off with, we need to estimate the next ten years of cash flows. Seeing as no analyst estimates of free cash flow are available to us, we have extrapolate the previous free cash flow (FCF) from the company's last reported value. We assume companies with shrinking free cash flow will slow their rate of shrinkage, and that companies with growing free cash flow will see their growth rate slow, over this period. We do this to reflect that growth tends to slow more in the early years than it does in later years.
A DCF is all about the idea that a dollar in the future is less valuable than a dollar today, and so the sum of these future cash flows is then discounted to today's value:
10-year free cash flow (FCF) estimate
| 2025 | 2026 | 2027 | 2028 | 2029 | 2030 | 2031 | 2032 | 2033 | 2034 | |
| Levered FCF ($, Millions) | US$99.8m | US$100.7m | US$102.1m | US$104.0m | US$106.2m | US$108.6m | US$111.3m | US$114.1m | US$117.1m | US$120.2m |
| Growth Rate Estimate Source | Est @ 0.08% | Est @ 0.88% | Est @ 1.44% | Est @ 1.83% | Est @ 2.11% | Est @ 2.30% | Est @ 2.44% | Est @ 2.53% | Est @ 2.60% | Est @ 2.64% |
| Present Value ($, Millions) Discounted @ 6.2% | US$94.0 | US$89.2 | US$85.2 | US$81.7 | US$78.6 | US$75.7 | US$73.0 | US$70.4 | US$68.1 | US$65.8 |
("Est" = FCF growth rate estimated by Simply Wall St)
Present Value of 10-year Cash Flow (PVCF) = US$782m
After calculating the present value of future cash flows in the initial 10-year period, we need to calculate the Terminal Value, which accounts for all future cash flows beyond the first stage. The Gordon Growth formula is used to calculate Terminal Value at a future annual growth rate equal to the 5-year average of the 10-year government bond yield of 2.8%. We discount the terminal cash flows to today's value at a cost of equity of 6.2%.
Terminal Value (TV)= FCF2034 × (1 + g) ÷ (r – g) = US$120m× (1 + 2.8%) ÷ (6.2%– 2.8%) = US$3.6b
Present Value of Terminal Value (PVTV)= TV / (1 + r)10= US$3.6b÷ ( 1 + 6.2%)10= US$2.0b
The total value is the sum of cash flows for the next ten years plus the discounted terminal value, which results in the Total Equity Value, which in this case is US$2.7b. To get the intrinsic value per share, we divide this by the total number of shares outstanding. Compared to the current share price of US$33.8, the company appears about fair value at a 9.8% discount to where the stock price trades currently. Valuations are imprecise instruments though, rather like a telescope - move a few degrees and end up in a different galaxy. Do keep this in mind.
The Assumptions
The calculation above is very dependent on two assumptions. The first is the discount rate and the other is the cash flows. Part of investing is coming up with your own evaluation of a company's future performance, so try the calculation yourself and check your own assumptions. The DCF also does not consider the possible cyclicality of an industry, or a company's future capital requirements, so it does not give a full picture of a company's potential performance. Given that we are looking at Tootsie Roll Industries as potential shareholders, the cost of equity is used as the discount rate, rather than the cost of capital (or weighted average cost of capital, WACC) which accounts for debt. In this calculation we've used 6.2%, which is based on a levered beta of 0.800. Beta is a measure of a stock's volatility, compared to the market as a whole. We get our beta from the industry average beta of globally comparable companies, with an imposed limit between 0.8 and 2.0, which is a reasonable range for a stable business.
Check out our latest analysis for Tootsie Roll Industries
SWOT Analysis for Tootsie Roll Industries
Strength
- Debt is not viewed as a risk.
- Dividends are covered by earnings and cash flows.
Weakness
- Earnings declined over the past year.
- Dividend is low compared to the top 25% of dividend payers in the Food market.
Opportunity
- Current share price is below our estimate of fair value.
- Lack of analyst coverage makes it difficult to determine TR's earnings prospects.
Threat
- No apparent threats visible for TR.
Moving On:
Whilst important, the DCF calculation is only one of many factors that you need to assess for a company. DCF models are not the be-all and end-all of investment valuation. Instead the best use for a DCF model is to test certain assumptions and theories to see if they would lead to the company being undervalued or overvalued. If a company grows at a different rate, or if its cost of equity or risk free rate changes sharply, the output can look very different. For Tootsie Roll Industries, we've compiled three additional items you should consider:
- Financial Health: Does TR have a healthy balance sheet? Take a look at our free balance sheet analysis with six simple checks on key factors like leverage and risk.
- Other High Quality Alternatives: Do you like a good all-rounder? Explore our interactive list of high quality stocks to get an idea of what else is out there you may be missing!
- Other Environmentally-Friendly Companies: Concerned about the environment and think consumers will buy eco-friendly products more and more? Browse through our interactive list of companies that are thinking about a greener future to discover some stocks you may not have thought of!
PS. The Simply Wall St app conducts a discounted cash flow valuation for every stock on the NYSE every day. If you want to find the calculation for other stocks just search here.
Valuation is complex, but we're here to simplify it.
Discover if Tootsie Roll Industries might be undervalued or overvalued with our detailed analysis, featuring fair value estimates, potential risks, dividends, insider trades, and its financial condition.
Access Free AnalysisHave feedback on this article? Concerned about the content? Get in touch with us directly. Alternatively, email editorial-team (at) simplywallst.com.
This article by Simply Wall St is general in nature. We provide commentary based on historical data and analyst forecasts only using an unbiased methodology and our articles are not intended to be financial advice. It does not constitute a recommendation to buy or sell any stock, and does not take account of your objectives, or your financial situation. We aim to bring you long-term focused analysis driven by fundamental data. Note that our analysis may not factor in the latest price-sensitive company announcements or qualitative material. Simply Wall St has no position in any stocks mentioned.
About NYSE:TR
Tootsie Roll Industries
Manufactures and sells confectionery products in the United States, Canada, Mexico, and internationally.
Flawless balance sheet average dividend payer.
Similar Companies
Market Insights

Advertisement
Weekly Picks
WO

woodworthfund on MGP Ingredients ·
THE KINGDOM OF BROWN GOODS: WHY MGPI IS BEING CRUSHED BY INVENTORY & PRIMED FOR RESURRECTION
Fair Value:US$4034.1% undervalued
20 followersusers have followed this narrative
1 commentusers have commented on this narrative
5 likesusers have liked this narrative
DO


Double_Bubbler on Vertical Aerospace ·
Why Vertical Aerospace (NYSE: EVTL) is Worth Possibly Over 13x its Current Price
Fair Value:US$6089.9% undervalued
22 followersusers have followed this narrative
2 commentsusers have commented on this narrative
17 likesusers have liked this narrative
TI


TickerTickle on Oracle ·
The Quiet Giant That Became AI’s Power Grid
Fair Value:US$389.8149.0% undervalued
43 followersusers have followed this narrative
3 commentsusers have commented on this narrative
8 likesusers have liked this narrative
Recently Updated Narratives
KI

KiwiInvest on Rocket Lab ·
Rocket Lab USA Will Ignite a 30% Revenue Growth Journey
Fair Value:US$97.8335.1% undervalued
136 followersusers have followed this narrative
8 commentsusers have commented on this narrative
0 likesusers have liked this narrative
BA


Bauyrzhan on Dollar General ·
Dollar general to grow
Fair Value:US$158.916.5% undervalued
1 followerusers have followed this narrative
0 commentsusers have commented on this narrative
0 likesusers have liked this narrative
MH


mhbb on Mastersystem Infotama ·
Mastersystem Infotama will achieve 18.9% revenue growth as fair value hits IDR1,650
Fair Value:Rp1.63k13.8% undervalued
2 followersusers have followed this narrative
0 commentsusers have commented on this narrative
0 likesusers have liked this narrative
Popular Narratives
TH


TheWallstreetKing on MicroVision ·
MicroVision will explode future revenue by 380.37% with a vision towards success
Fair Value:US$6098.4% undervalued
119 followersusers have followed this narrative
11 commentsusers have commented on this narrative
22 likesusers have liked this narrative
AN


AnalystConsensusTarget on NVIDIA ·
NVDA: Expanding AI Demand Will Drive Major Data Center Investments Through 2026
Fair Value:US$250.3927.7% undervalued
963 followersusers have followed this narrative
6 commentsusers have commented on this narrative
25 likesusers have liked this narrative
RO


RockeTeller on Santacruz Silver Mining ·
Crazy Undervalued 42 Baggers Silver Play (Active & Running Mine)
Fair Value:CA$8688.0% undervalued
77 followersusers have followed this narrative
8 commentsusers have commented on this narrative
21 likesusers have liked this narrative

