- United States
- /
- Food
- /
- NYSE:FLO
Flowers Foods' (NYSE:FLO) five-year total shareholder returns outpace the underlying earnings growth


Flowers Foods, Inc. (NYSE:FLO) shareholders have seen the share price descend 10% over the month. On the bright side the share price is up over the last half decade. Unfortunately its return of 24% is below the market return of 58%.
Since the long term performance has been good but there's been a recent pullback of 3.9%, let's check if the fundamentals match the share price.
View our latest analysis for Flowers Foods
SWOT Analysis for Flowers Foods
- Debt is well covered by earnings and cashflows.
- Earnings declined over the past year.
- Dividend is low compared to the top 25% of dividend payers in the Food market.
- Annual earnings are forecast to grow for the next 3 years.
- Current share price is below our estimate of fair value.
- Dividends are not covered by cash flow.
- Annual earnings are forecast to grow slower than the American market.
To quote Buffett, 'Ships will sail around the world but the Flat Earth Society will flourish. There will continue to be wide discrepancies between price and value in the marketplace...' One flawed but reasonable way to assess how sentiment around a company has changed is to compare the earnings per share (EPS) with the share price.
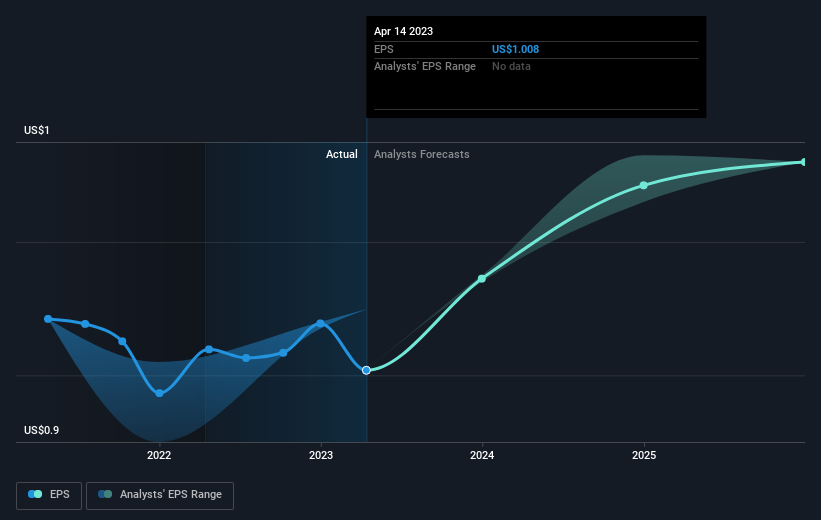
During five years of share price growth, Flowers Foods achieved compound earnings per share (EPS) growth of 8.5% per year. This EPS growth is higher than the 4% average annual increase in the share price. So it seems the market isn't so enthusiastic about the stock these days.
The graphic below depicts how EPS has changed over time (unveil the exact values by clicking on the image).
We consider it positive that insiders have made significant purchases in the last year. Even so, future earnings will be far more important to whether current shareholders make money. Dive deeper into the earnings by checking this interactive graph of Flowers Foods' earnings, revenue and cash flow.
What About Dividends?
As well as measuring the share price return, investors should also consider the total shareholder return (TSR). Whereas the share price return only reflects the change in the share price, the TSR includes the value of dividends (assuming they were reinvested) and the benefit of any discounted capital raising or spin-off. So for companies that pay a generous dividend, the TSR is often a lot higher than the share price return. In the case of Flowers Foods, it has a TSR of 45% for the last 5 years. That exceeds its share price return that we previously mentioned. This is largely a result of its dividend payments!
A Different Perspective
While the broader market gained around 1.6% in the last year, Flowers Foods shareholders lost 2.4% (even including dividends). Even the share prices of good stocks drop sometimes, but we want to see improvements in the fundamental metrics of a business, before getting too interested. Longer term investors wouldn't be so upset, since they would have made 8%, each year, over five years. It could be that the recent sell-off is an opportunity, so it may be worth checking the fundamental data for signs of a long term growth trend. I find it very interesting to look at share price over the long term as a proxy for business performance. But to truly gain insight, we need to consider other information, too. To that end, you should be aware of the 2 warning signs we've spotted with Flowers Foods .
If you like to buy stocks alongside management, then you might just love this free list of companies. (Hint: insiders have been buying them).
Please note, the market returns quoted in this article reflect the market weighted average returns of stocks that currently trade on American exchanges.
If you're looking to trade Flowers Foods, open an account with the lowest-cost platform trusted by professionals, Interactive Brokers.
With clients in over 200 countries and territories, and access to 160 markets, IBKR lets you trade stocks, options, futures, forex, bonds and funds from a single integrated account.
Enjoy no hidden fees, no account minimums, and FX conversion rates as low as 0.03%, far better than what most brokers offer.
Sponsored ContentNew: AI Stock Screener & Alerts
Our new AI Stock Screener scans the market every day to uncover opportunities.
• Dividend Powerhouses (3%+ Yield)
• Undervalued Small Caps with Insider Buying
• High growth Tech and AI Companies
Or build your own from over 50 metrics.
Have feedback on this article? Concerned about the content? Get in touch with us directly. Alternatively, email editorial-team (at) simplywallst.com.
This article by Simply Wall St is general in nature. We provide commentary based on historical data and analyst forecasts only using an unbiased methodology and our articles are not intended to be financial advice. It does not constitute a recommendation to buy or sell any stock, and does not take account of your objectives, or your financial situation. We aim to bring you long-term focused analysis driven by fundamental data. Note that our analysis may not factor in the latest price-sensitive company announcements or qualitative material. Simply Wall St has no position in any stocks mentioned.
About NYSE:FLO
Flowers Foods
Produces and markets packaged bakery food products in the United States.
6 star dividend payer with solid track record.
Similar Companies
Market Insights

Community Narratives


