- United States
- /
- Oil and Gas
- /
- NYSE:XOM
Those who invested in Exxon Mobil (NYSE:XOM) three years ago are up 126%


One simple way to benefit from the stock market is to buy an index fund. But if you buy good businesses at attractive prices, your portfolio returns could exceed the average market return. For example, the Exxon Mobil Corporation (NYSE:XOM) share price is up 100% in the last three years, clearly besting the market return of around 19% (not including dividends). On the other hand, the returns haven't been quite so good recently, with shareholders up just 12% , including dividends .
With that in mind, it's worth seeing if the company's underlying fundamentals have been the driver of long term performance, or if there are some discrepancies.
Check out our latest analysis for Exxon Mobil
While the efficient markets hypothesis continues to be taught by some, it has been proven that markets are over-reactive dynamic systems, and investors are not always rational. One flawed but reasonable way to assess how sentiment around a company has changed is to compare the earnings per share (EPS) with the share price.
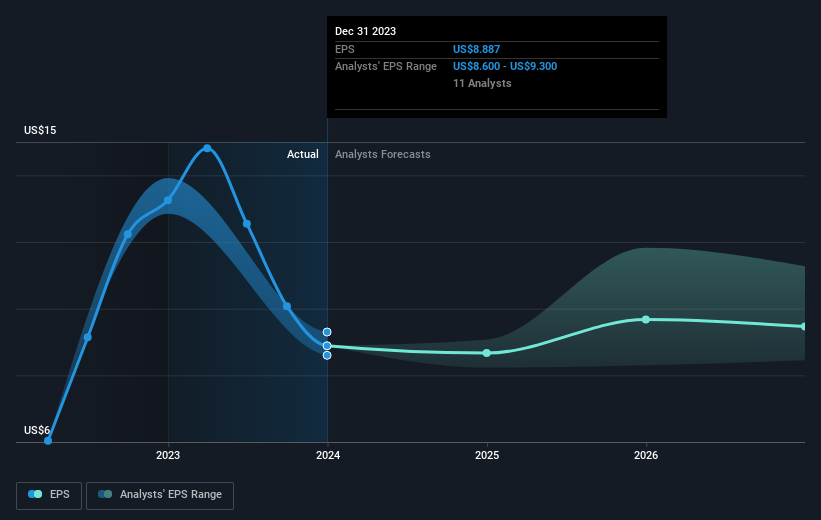
Exxon Mobil became profitable within the last three years. That would generally be considered a positive, so we'd expect the share price to be up.
The graphic below depicts how EPS has changed over time (unveil the exact values by clicking on the image).
It is of course excellent to see how Exxon Mobil has grown profits over the years, but the future is more important for shareholders. If you are thinking of buying or selling Exxon Mobil stock, you should check out this FREE detailed report on its balance sheet.
What About Dividends?
When looking at investment returns, it is important to consider the difference between total shareholder return (TSR) and share price return. The TSR is a return calculation that accounts for the value of cash dividends (assuming that any dividend received was reinvested) and the calculated value of any discounted capital raisings and spin-offs. Arguably, the TSR gives a more comprehensive picture of the return generated by a stock. As it happens, Exxon Mobil's TSR for the last 3 years was 126%, which exceeds the share price return mentioned earlier. This is largely a result of its dividend payments!
A Different Perspective
Exxon Mobil provided a TSR of 12% over the last twelve months. But that return falls short of the market. On the bright side, the longer term returns (running at about 13% a year, over half a decade) look better. It may well be that this is a business worth popping on the watching, given the continuing positive reception, over time, from the market. I find it very interesting to look at share price over the long term as a proxy for business performance. But to truly gain insight, we need to consider other information, too. Consider for instance, the ever-present spectre of investment risk. We've identified 1 warning sign with Exxon Mobil , and understanding them should be part of your investment process.
If you like to buy stocks alongside management, then you might just love this free list of companies. (Hint: insiders have been buying them).
Please note, the market returns quoted in this article reflect the market weighted average returns of stocks that currently trade on American exchanges.
Valuation is complex, but we're here to simplify it.
Discover if Exxon Mobil might be undervalued or overvalued with our detailed analysis, featuring fair value estimates, potential risks, dividends, insider trades, and its financial condition.
Access Free AnalysisHave feedback on this article? Concerned about the content? Get in touch with us directly. Alternatively, email editorial-team (at) simplywallst.com.
This article by Simply Wall St is general in nature. We provide commentary based on historical data and analyst forecasts only using an unbiased methodology and our articles are not intended to be financial advice. It does not constitute a recommendation to buy or sell any stock, and does not take account of your objectives, or your financial situation. We aim to bring you long-term focused analysis driven by fundamental data. Note that our analysis may not factor in the latest price-sensitive company announcements or qualitative material. Simply Wall St has no position in any stocks mentioned.
About NYSE:XOM
Exxon Mobil
Engages in the exploration and production of crude oil and natural gas in the United States, Canada, the United Kingdom, Singapore, France, and internationally.
Excellent balance sheet established dividend payer.
Similar Companies
Market Insights


Community Narratives


