- United States
- /
- Oil and Gas
- /
- NYSE:XOM
Is Weakness In Exxon Mobil Corporation (NYSE:XOM) Stock A Sign That The Market Could be Wrong Given Its Strong Financial Prospects?


With its stock down 3.4% over the past three months, it is easy to disregard Exxon Mobil (NYSE:XOM). However, a closer look at its sound financials might cause you to think again. Given that fundamentals usually drive long-term market outcomes, the company is worth looking at. Particularly, we will be paying attention to Exxon Mobil's ROE today.
ROE or return on equity is a useful tool to assess how effectively a company can generate returns on the investment it received from its shareholders. Simply put, it is used to assess the profitability of a company in relation to its equity capital.
View our latest analysis for Exxon Mobil
How Is ROE Calculated?
Return on equity can be calculated by using the formula:
Return on Equity = Net Profit (from continuing operations) ÷ Shareholders' Equity
So, based on the above formula, the ROE for Exxon Mobil is:
13% = US$35b ÷ US$271b (Based on the trailing twelve months to December 2024).
The 'return' refers to a company's earnings over the last year. One way to conceptualize this is that for each $1 of shareholders' capital it has, the company made $0.13 in profit.
Why Is ROE Important For Earnings Growth?
So far, we've learned that ROE is a measure of a company's profitability. Based on how much of its profits the company chooses to reinvest or "retain", we are then able to evaluate a company's future ability to generate profits. Assuming everything else remains unchanged, the higher the ROE and profit retention, the higher the growth rate of a company compared to companies that don't necessarily bear these characteristics.
Exxon Mobil's Earnings Growth And 13% ROE
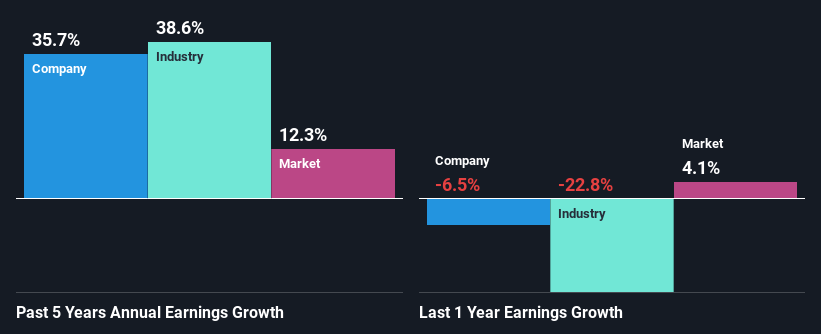
At first glance, Exxon Mobil seems to have a decent ROE. And on comparing with the industry, we found that the the average industry ROE is similar at 14%. This certainly adds some context to Exxon Mobil's exceptional 36% net income growth seen over the past five years. However, there could also be other drivers behind this growth. For example, it is possible that the company's management has made some good strategic decisions, or that the company has a low payout ratio.
We then performed a comparison between Exxon Mobil's net income growth with the industry, which revealed that the company's growth is similar to the average industry growth of 39% in the same 5-year period.
Earnings growth is an important metric to consider when valuing a stock. It’s important for an investor to know whether the market has priced in the company's expected earnings growth (or decline). Doing so will help them establish if the stock's future looks promising or ominous. Has the market priced in the future outlook for XOM? You can find out in our latest intrinsic value infographic research report.
Is Exxon Mobil Making Efficient Use Of Its Profits?
Exxon Mobil's three-year median payout ratio is a pretty moderate 41%, meaning the company retains 59% of its income. By the looks of it, the dividend is well covered and Exxon Mobil is reinvesting its profits efficiently as evidenced by its exceptional growth which we discussed above.
Moreover, Exxon Mobil is determined to keep sharing its profits with shareholders which we infer from its long history of paying a dividend for at least ten years. Our latest analyst data shows that the future payout ratio of the company over the next three years is expected to be approximately 45%. Therefore, the company's future ROE is also not expected to change by much with analysts predicting an ROE of 15%.
Conclusion
Overall, we are quite pleased with Exxon Mobil's performance. Specifically, we like that the company is reinvesting a huge chunk of its profits at a high rate of return. This of course has caused the company to see substantial growth in its earnings. Having said that, the company's earnings growth is expected to slow down, as forecasted in the current analyst estimates. To know more about the latest analysts predictions for the company, check out this visualization of analyst forecasts for the company.
If you're looking to trade Exxon Mobil, open an account with the lowest-cost platform trusted by professionals, Interactive Brokers.
With clients in over 200 countries and territories, and access to 160 markets, IBKR lets you trade stocks, options, futures, forex, bonds and funds from a single integrated account.
Enjoy no hidden fees, no account minimums, and FX conversion rates as low as 0.03%, far better than what most brokers offer.
Sponsored ContentValuation is complex, but we're here to simplify it.
Discover if Exxon Mobil might be undervalued or overvalued with our detailed analysis, featuring fair value estimates, potential risks, dividends, insider trades, and its financial condition.
Access Free AnalysisHave feedback on this article? Concerned about the content? Get in touch with us directly. Alternatively, email editorial-team (at) simplywallst.com.
This article by Simply Wall St is general in nature. We provide commentary based on historical data and analyst forecasts only using an unbiased methodology and our articles are not intended to be financial advice. It does not constitute a recommendation to buy or sell any stock, and does not take account of your objectives, or your financial situation. We aim to bring you long-term focused analysis driven by fundamental data. Note that our analysis may not factor in the latest price-sensitive company announcements or qualitative material. Simply Wall St has no position in any stocks mentioned.
About NYSE:XOM
Exxon Mobil
Engages in the exploration and production of crude oil and natural gas in the United States, Canada, the United Kingdom, Singapore, France, and internationally.
Excellent balance sheet established dividend payer.
Similar Companies
Market Insights

Community Narratives
