
Advertisement
- United States
- /
- Energy Services
- /
- NYSE:OII
Returns On Capital Are Showing Encouraging Signs At Oceaneering International (NYSE:OII)
If you're looking for a multi-bagger, there's a few things to keep an eye out for. In a perfect world, we'd like to see a company investing more capital into its business and ideally the returns earned from that capital are also increasing. Ultimately, this demonstrates that it's a business that is reinvesting profits at increasing rates of return. Speaking of which, we noticed some great changes in Oceaneering International's (NYSE:OII) returns on capital, so let's have a look.
What Is Return On Capital Employed (ROCE)?
If you haven't worked with ROCE before, it measures the 'return' (pre-tax profit) a company generates from capital employed in its business. To calculate this metric for Oceaneering International, this is the formula:
Return on Capital Employed = Earnings Before Interest and Tax (EBIT) ÷ (Total Assets - Current Liabilities)
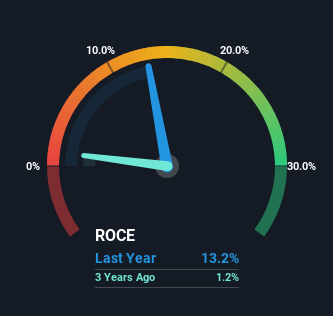
0.13 = US$202m ÷ (US$2.3b - US$777m) (Based on the trailing twelve months to June 2024).
Thus, Oceaneering International has an ROCE of 13%. In absolute terms, that's a pretty normal return, and it's somewhat close to the Energy Services industry average of 11%.
Check out our latest analysis for Oceaneering International
In the above chart we have measured Oceaneering International's prior ROCE against its prior performance, but the future is arguably more important. If you'd like, you can check out the forecasts from the analysts covering Oceaneering International for free.
How Are Returns Trending?
It's great to see that Oceaneering International has started to generate some pre-tax earnings from prior investments. Historically the company was generating losses but as we can see from the latest figures referenced above, they're now earning 13% on their capital employed. At first glance, it seems the business is getting more proficient at generating returns, because over the same period, the amount of capital employed has reduced by 38%. The reduction could indicate that the company is selling some assets, and considering returns are up, they appear to be selling the right ones.
For the record though, there was a noticeable increase in the company's current liabilities over the period, so we would attribute some of the ROCE growth to that. Effectively this means that suppliers or short-term creditors are now funding 34% of the business, which is more than it was five years ago. It's worth keeping an eye on this because as the percentage of current liabilities to total assets increases, some aspects of risk also increase.
What We Can Learn From Oceaneering International's ROCE
In the end, Oceaneering International has proven it's capital allocation skills are good with those higher returns from less amount of capital. And investors seem to expect more of this going forward, since the stock has rewarded shareholders with a 95% return over the last five years. Therefore, we think it would be worth your time to check if these trends are going to continue.
If you want to continue researching Oceaneering International, you might be interested to know about the 1 warning sign that our analysis has discovered.
While Oceaneering International isn't earning the highest return, check out this free list of companies that are earning high returns on equity with solid balance sheets.
New: AI Stock Screener & Alerts
Our new AI Stock Screener scans the market every day to uncover opportunities.
• Dividend Powerhouses (3%+ Yield)
• Undervalued Small Caps with Insider Buying
• High growth Tech and AI Companies
Or build your own from over 50 metrics.
Have feedback on this article? Concerned about the content? Get in touch with us directly. Alternatively, email editorial-team (at) simplywallst.com.
This article by Simply Wall St is general in nature. We provide commentary based on historical data and analyst forecasts only using an unbiased methodology and our articles are not intended to be financial advice. It does not constitute a recommendation to buy or sell any stock, and does not take account of your objectives, or your financial situation. We aim to bring you long-term focused analysis driven by fundamental data. Note that our analysis may not factor in the latest price-sensitive company announcements or qualitative material. Simply Wall St has no position in any stocks mentioned.
About NYSE:OII
Oceaneering International
Provides engineered services and products, and robotic solutions to the offshore energy, defense, aerospace, manufacturing, and entertainment industries in the United States, Africa, the United Kingdom, Norway, Brazil, Asia, Australia, and internationally.
Flawless balance sheet and undervalued.
Similar Companies
Market Insights

Advertisement
Community Narratives
A formidable player in AI and enterprise computing.
Fair Value US$210.00|2.3% overvalued
CO
Community Contributor
IREN's Bold Moves in Sustainable Bitcoin Mining & AI Data Centers
Fair Value US$72.52|17.6% undervalued
BL
Community Contributor
Cooling the Champions: The Aussie Tech Behind F1's Victories
Fair Value AU$12.40|42.0% undervalued
TR
Community Contributor