Advertisement
- United States
- /
- Capital Markets
- /
- NYSE:RJF
Is There Room for Raymond James Shares to Grow After Strong 5-Year Run in 2025?

Simply Wall St
Reviewed by Bailey Pemberton
If you have been wondering what to do with Raymond James Financial shares as they hover around the $160 mark, you are not alone. The stock certainly grabs attention with its long-term chart, up a staggering 223.9% over five years, handily outpacing the broader market. That impressive climb is not just ancient history, either. Despite a bumpy 7-day stretch and a flat month, shares are still up 25% over the last year and 3.4% year-to-date. Investors have started to re-calibrate their risk-reward expectations, and occasional dips can hint at shifting sentiment, but the growth story underlying Raymond James remains hard to ignore.
With the financial sector reacting to changing rates, shifting investor preferences, and the ever-present headlines about market volatility, it is important to dig deeper into whether Raymond James is actually undervalued or if its recent run has already priced in the good news. Here is where things get interesting: using six classic valuation checks, the company earns a value score of 4. In other words, it looks undervalued on four out of six major metrics, a strong showing but not a slam dunk.
Next, let us break down what these valuation checks really tell us and which ones matter most for Raymond James. And if you have ever wondered whether there is a smarter, more holistic way to size up value than these old-school approaches, you will not want to miss the conclusion.
Why Raymond James Financial is lagging behind its peers
Approach 1: Raymond James Financial Excess Returns Analysis
The Excess Returns model evaluates a company by measuring how much profit it generates over and above the required return for its shareholders. In simple terms, it asks whether the company is making more from its investments than it costs to raise the money for those investments, and if so, by how much.
For Raymond James Financial, the key numbers are impressive. The company’s Book Value stands at $60.90 per share, while its Stable Earnings Per Share (EPS) are estimated at $12.04, based on projections from six analysts. The average Return on Equity is a strong 19.01 percent, well above the estimated Cost of Equity of $5.36 per share. As a result, Raymond James is posting an Excess Return of $6.68 per share, indicating the company consistently delivers profits beyond what investors typically demand. Looking ahead, the Stable Book Value is expected to be $63.36 per share, according to four analysts contributing to the forecast.
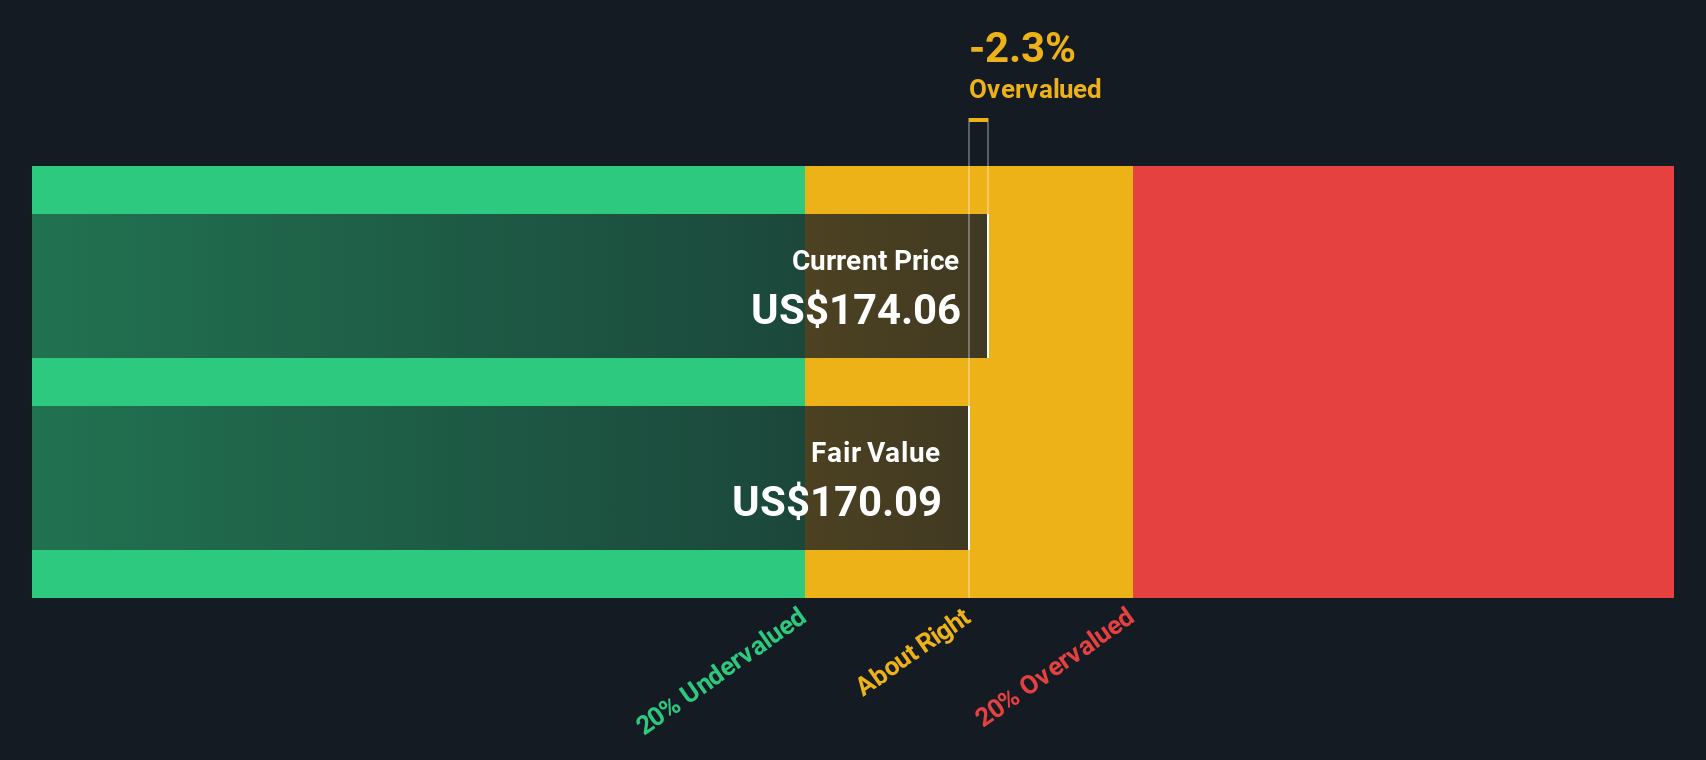
This approach calculates an intrinsic value of $187.41 per share, about 14.5 percent above the current market price. In other words, the Excess Returns analysis signals the stock is undervalued at current levels.
Result: UNDERVALUED
Our Excess Returns analysis suggests Raymond James Financial is undervalued by 14.5%. Track this in your watchlist or portfolio, or discover more undervalued stocks.
Approach 2: Raymond James Financial Price vs Earnings
The Price-to-Earnings (PE) ratio is widely regarded as the go-to valuation metric for profitable companies because it directly connects the stock price to the company’s bottom line. Investors often prefer this multiple when there is a clear earnings trajectory and consistent profitability, making it an effective way to compare stocks both within and across industries.
However, understanding what constitutes a "fair" PE ratio takes more than simply checking a single number. Growth prospects and risk levels play a crucial role. Faster-growing or lower-risk businesses typically command higher multiples, while slower or riskier ones generally trade at lower PE ratios. Context is key.
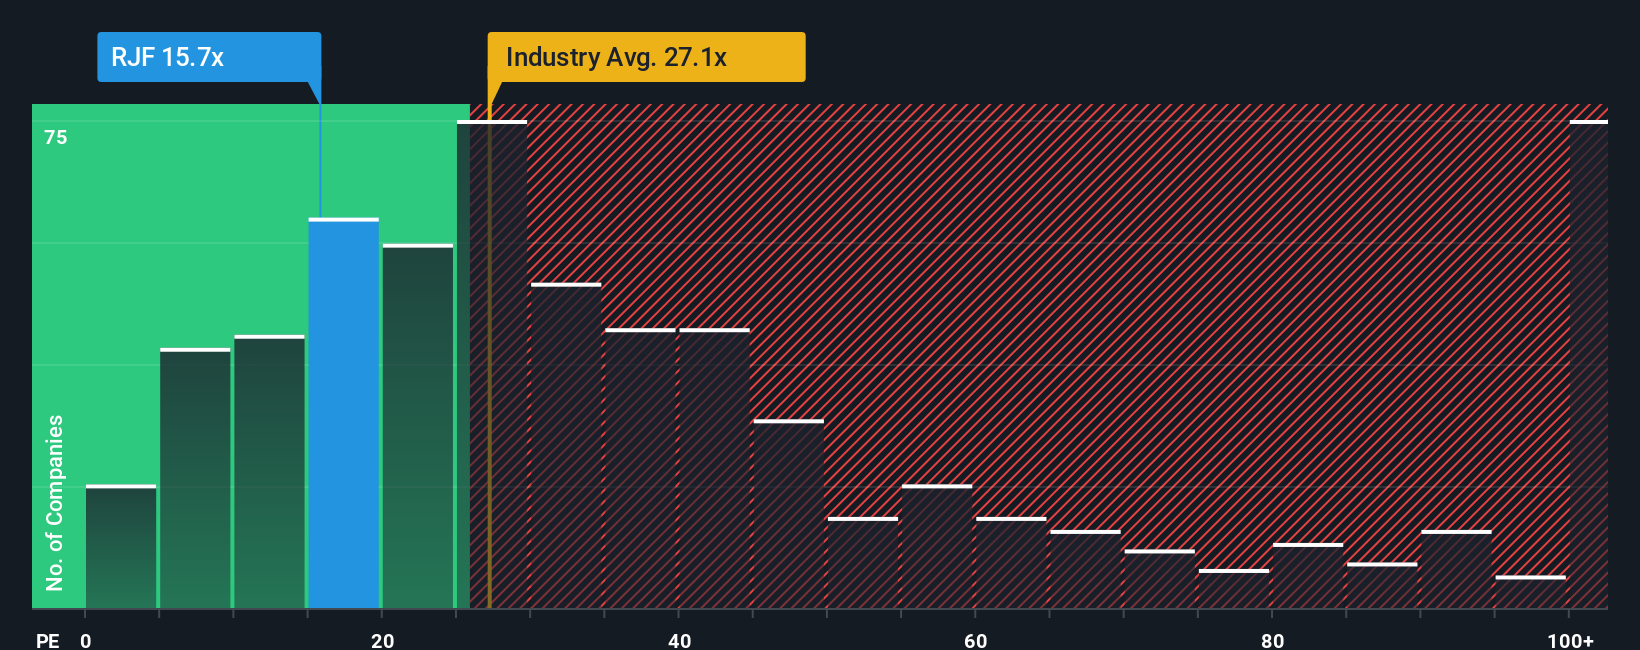
Raymond James Financial is currently trading on a PE ratio of 15x, which stands out as a discount relative to both the Capital Markets industry average of 24.9x and the peer average of 23.1x. But instead of stopping there, let's take a closer look at the Fair Ratio, a proprietary metric from Simply Wall St that blends not just industry benchmarks but also factors in Raymond James’s earnings growth, profit margin, market cap, and risk profile. The Fair Ratio for Raymond James is calculated at 17.3x, offering a more tailored benchmark than standard industry or peer comparisons.
By comparing the actual PE of 15x with the Fair Ratio of 17.3x, the stock appears undervalued based on the metrics that matter most to its future performance and risk profile.
Result: UNDERVALUED
PE ratios tell one story, but what if the real opportunity lies elsewhere? Discover companies where insiders are betting big on explosive growth.
Upgrade Your Decision Making: Choose your Raymond James Financial Narrative
Earlier, we suggested there is a more insightful way to approach valuation. That method is called a Narrative. A Narrative is simply your personal story about a company, supported by your outlook for its financial future, including your assumptions for fair value, revenue growth, profit margins, and other key estimates. Instead of relying solely on traditional metrics, Narratives connect the business’s real-world story directly to an evolving financial forecast and a calculated fair value. This approach helps you see the bigger picture beyond just numbers or ratios.
This tool is both accessible and dynamic, available for every stock (including Raymond James Financial) on Simply Wall St’s platform. Millions of investors share perspectives and forecasts within the Community page. Narratives automatically update as news or earnings arrive, ensuring your outlook is always current. When you build or compare Narratives, you can quickly see if your estimated Fair Value is above or below the current market price, providing a crucial signal for your buy or sell decision.
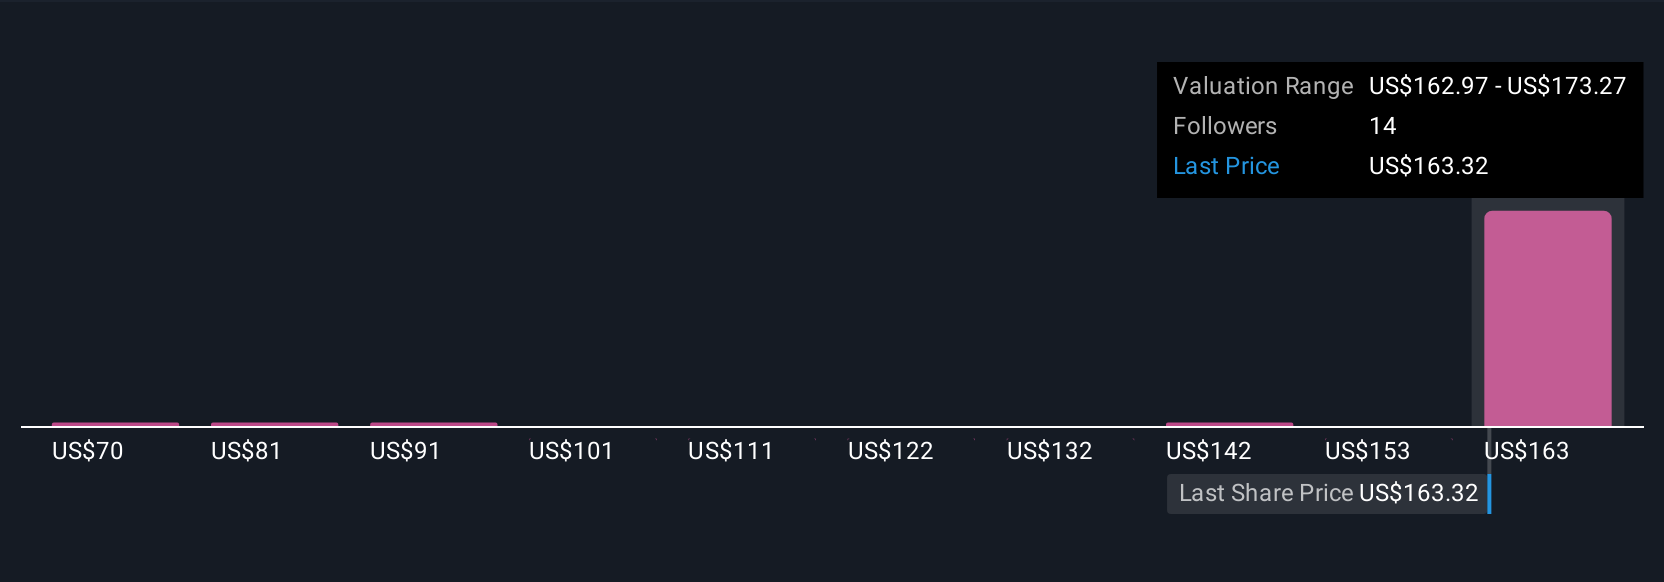
For example, some investors currently forecast a fair value for Raymond James Financial as high as $175.83, while others project as low as $165.59. That range captures the variety of real investor perspectives and lets you decide which story makes the most sense to act on.
Do you think there's more to the story for Raymond James Financial? Create your own Narrative to let the Community know!
This article by Simply Wall St is general in nature. We provide commentary based on historical data and analyst forecasts only using an unbiased methodology and our articles are not intended to be financial advice. It does not constitute a recommendation to buy or sell any stock, and does not take account of your objectives, or your financial situation. We aim to bring you long-term focused analysis driven by fundamental data. Note that our analysis may not factor in the latest price-sensitive company announcements or qualitative material. Simply Wall St has no position in any stocks mentioned.
New: AI Stock Screener & Alerts
Our new AI Stock Screener scans the market every day to uncover opportunities.
• Dividend Powerhouses (3%+ Yield)
• Undervalued Small Caps with Insider Buying
• High growth Tech and AI Companies
Or build your own from over 50 metrics.
Have feedback on this article? Concerned about the content? Get in touch with us directly. Alternatively, email editorial-team@simplywallst.com
About NYSE:RJF
Raymond James Financial
A diversified financial services company, provides private client group, capital markets, asset management, banking, and other services to individuals, corporations, and municipalities in the United States, Canada, and Europe.
Excellent balance sheet, good value and pays a dividend.
Similar Companies
Market Insights

Advertisement
Community Narratives
A formidable player in AI and enterprise computing.
Fair Value US$210.00|3.1% overvalued
CO
Community Contributor
IREN's Bold Moves in Sustainable Bitcoin Mining & AI Data Centers
Fair Value US$72.52|11.6% undervalued
BL
Community Contributor
Cooling the Champions: The Aussie Tech Behind F1's Victories
Fair Value AU$12.40|39.4% undervalued
TR
Community Contributor