Advertisement
- United States
- /
- Consumer Finance
- /
- NYSE:AXP
Does the Latest Amex Travel Growth Signal More Room for Shares in 2025?

Simply Wall St
Reviewed by Bailey Pemberton
If you own American Express stock, or you’re thinking about jumping in, you’ve probably noticed its share price has barely taken a breath lately. From the outside, it seems like a classic case of a company powering ahead, and the numbers bear that out. Over just the past year, American Express is up 21.3%, with a stunning 243.3% return over five years. These are results most investors would be thrilled to see in their portfolio. The stock has nudged up 1.5% in the past week and 2.3% over the last month, continuing its long-term streak and hinting that investor confidence remains solid, especially as the market digests ongoing changes in consumer spending and the travel landscape. Year to date, American Express has packed on another 11.5%, which is no small feat given all the chatter about rate shifts and economic headwinds.
But even the most exciting growth story should prompt a second look at value. Is the current price justified, or is it getting a bit ahead of itself? According to our valuation score, which adds a point for each of six different “undervalued” checks the company passes, American Express only scores a 1 out of 6. That’s a sign for thoughtful investors to dig deeper. Next, we’ll break down some of the most common ways the market measures value, and I’ll also let you in on a smarter approach savvy analysts use to gauge whether a stock is truly worth its sticker price.
American Express scores just 1/6 on our valuation checks. See what other red flags we found in the full valuation breakdown.
Approach 1: American Express Excess Returns Analysis
The Excess Returns model focuses on how much value a company creates above the required return that investors expect for the risk taken. In other words, it measures whether American Express is generating strong returns on its shareholders’ equity that exceed its cost of equity, rather than just growing for growth’s sake.
Looking closely at American Express, the company’s Book Value stands at $46.42 per share, while its Stable EPS reaches $18.30 per share. These estimates are drawn from analysts’ forward-looking models and reflect the firm’s capacity to consistently generate profits. The Cost of Equity, which represents the returns investors require to justify their investment, comes in at $4.33 per share. This means American Express is delivering an Excess Return of $13.97 per share above what investors would typically demand. The company also posts an impressive average Return on Equity of 35.61 percent, with a Stable Book Value projected at $51.39 per share by industry experts.
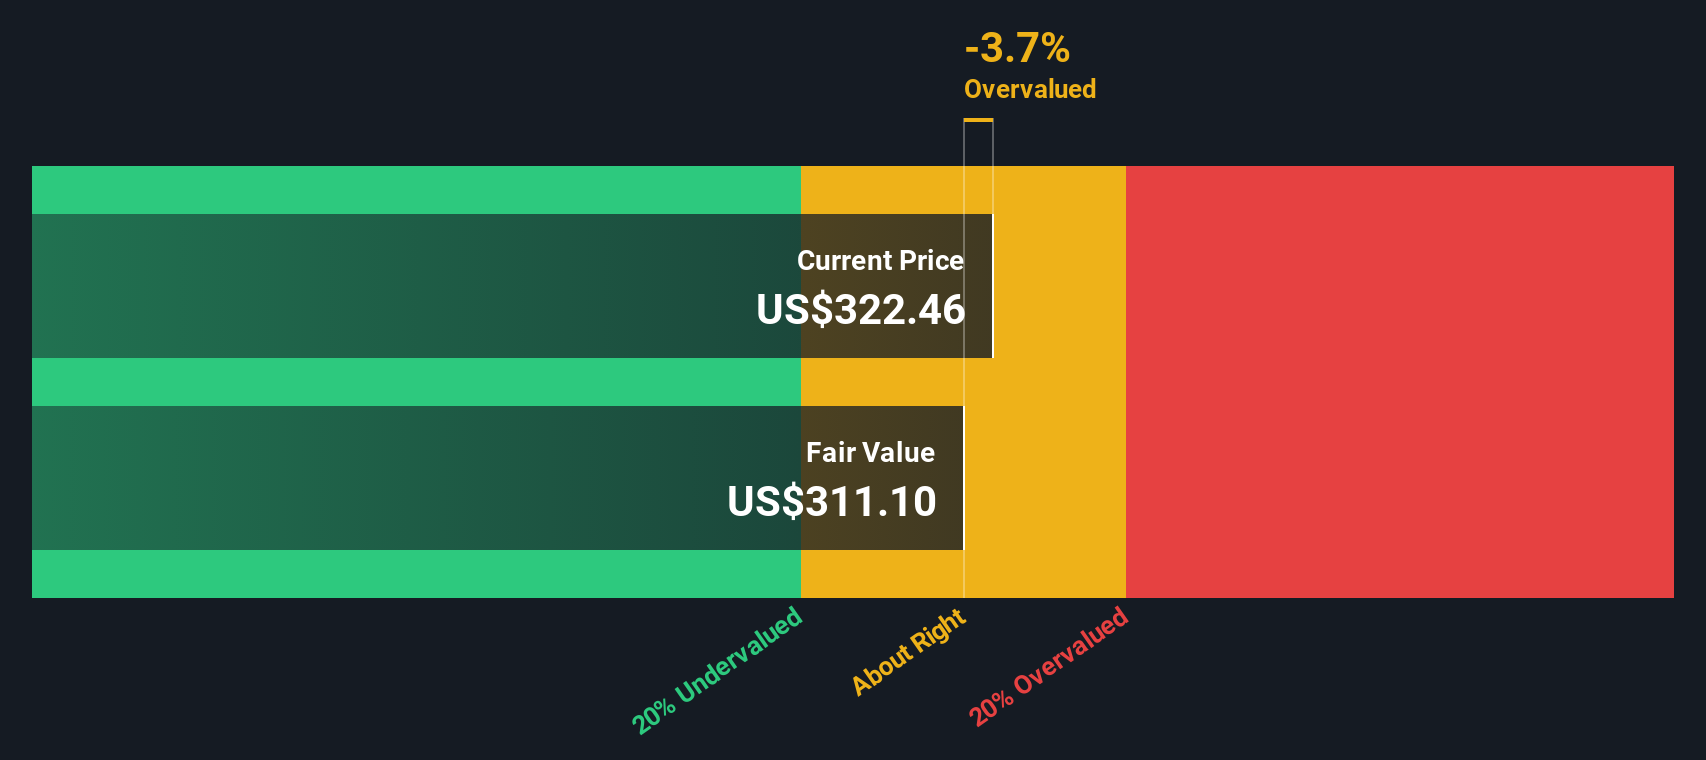
When we compare American Express’s estimated intrinsic value from the Excess Returns model with its current share price, the stock is trading about 6.3 percent above what this valuation suggests is fair. This small difference indicates the shares are priced close to their theoretical worth, neither strongly overvalued nor undervalued at this time.
Result: ABOUT RIGHT
Simply Wall St performs a valuation analysis on every stock in the world every day (check out American Express's valuation analysis). We show the entire calculation in full. You can track the result in your watchlist or portfolio and be alerted when this changes.
Approach 2: American Express Price vs Earnings
The price-to-earnings (PE) ratio is a go-to valuation tool for companies like American Express that consistently generate profits. It is a simple yet powerful way to gauge how much investors are willing to pay today for each dollar of future earnings, making it particularly useful for established, profitable businesses.
Growth expectations and risk are important factors in determining what qualifies as a “normal” or “fair” PE ratio. Higher anticipated growth or lower business risk often justify higher multiples, while slower-growing or riskier firms typically warrant a lower PE.
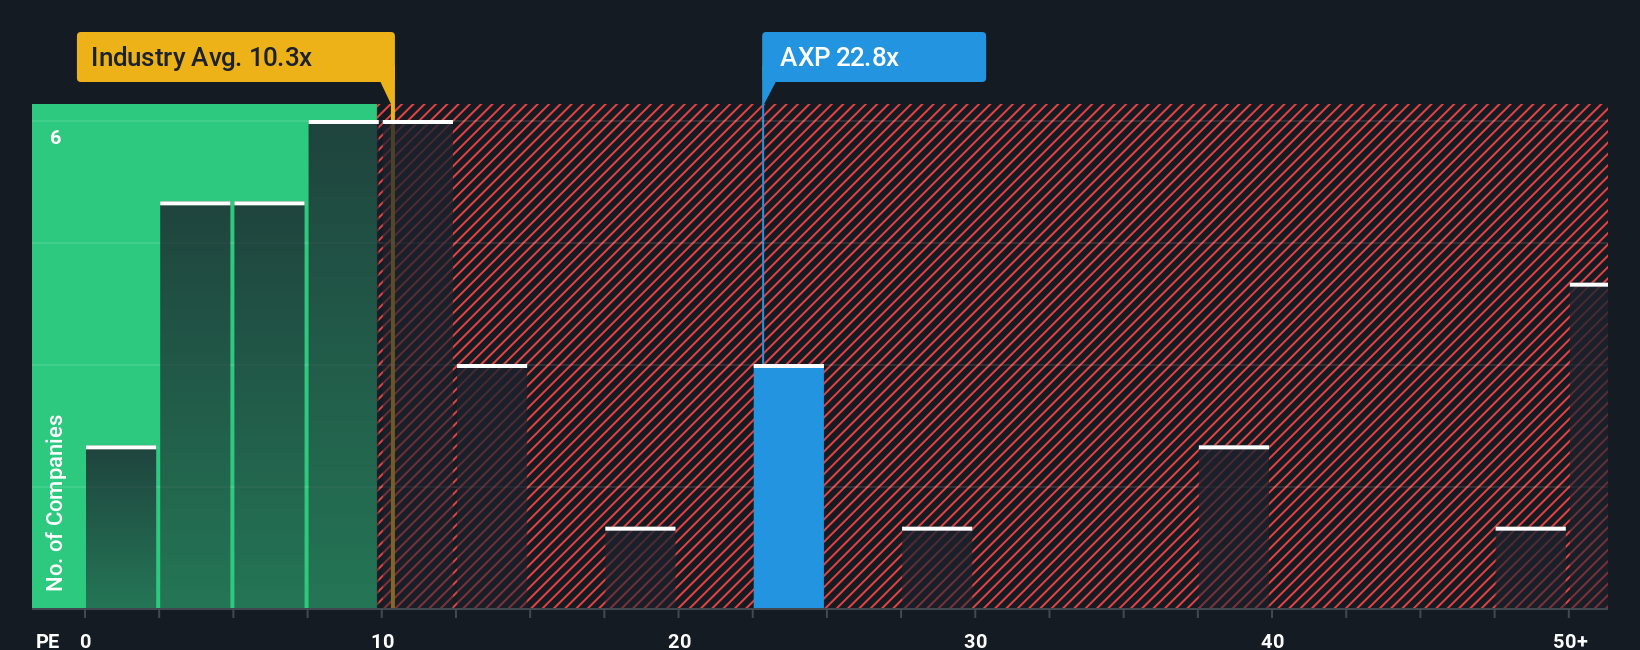
Right now, American Express trades at a PE of 23.1x. For context, this stands well above the Consumer Finance industry average of 9.8x, but slightly below the peer average of 30x. However, raw comparisons can be misleading since they ignore individual characteristics such as growth prospects, profitability, and scale. That is where Simply Wall St’s “Fair Ratio” comes in. This proprietary measure sets a personalized benchmark in AXP’s case, 21.3x, reflecting all those contextual factors rather than just broad industry snapshots.
Given American Express’s current PE of 23.1x against its Fair Ratio of 21.3x, the difference is modest. The stock looks just about right when it comes to valuation on this metric. Even though it is priced richer than the industry as a whole, it is not meaningfully out of line given its strengths and outlook.
Result: ABOUT RIGHT
PE ratios tell one story, but what if the real opportunity lies elsewhere? Discover companies where insiders are betting big on explosive growth.
Upgrade Your Decision Making: Choose your American Express Narrative
Earlier we mentioned that there is an even better way to understand valuation, so let us introduce you to Narratives. A Narrative is essentially your “story” behind the stock's numbers, where you can connect your perspective on a company's future by drawing on your assumptions for fair value, future revenue, earnings, and margins along with what actually drives its share price.
Instead of only relying on static ratios, Narratives bring together everything you know about American Express’s business trends, real-world developments, and your own forecasts. This all builds into a dynamic, personalized fair value. On the Simply Wall St platform, millions of investors use Narratives within the Community page, where sharing and updating your view is not only accessible but also responsive to news and earnings as they happen.
Narratives help you decide when to buy or sell by comparing your Fair Value against the current Price. Since they update automatically with fresh information, your decisions can stay in sync with market realities. For example, some investors might see American Express’s international expansion, card refreshes, and premium customer base justifying a fair value as high as $366.63. Others, concerned by slowing travel spend, increasing competition, or rising costs, might argue for a more cautious $230.00 fair value instead.
For American Express, here are previews of two leading American Express Narratives:
- 🐂 American Express Bull Case
Fair Value: $366.63
Current valuation: 9.2% undervalued (based on last close of $332.85)
Forecast annual revenue growth: 11.1%
- Growth is powered by expanding the younger customer base, increasing international reach, and premium product upgrades aligned to global affluence.
- Ongoing technology investments and B2B solutions support top-tier profitability, retention, and SME-focused revenue diversification.
- Risks include digital payment disruption, rising competition, higher costs, structural funding disadvantages, and regulatory headwinds. Bullish estimates see scope for significant share price upside.
- 🐻 American Express Bear Case
Fair Value: $329.62
Current valuation: 1.0% overvalued (based on last close of $332.85)
Forecast annual revenue growth: 10.5%
- Premium cardmembers, product innovation, and success with younger demographics drive retention and long-term international growth.
- Strong credit quality and capital discipline enable ongoing investment and margin expansion, even as competition intensifies.
- Challenges include saturated US market reliance, threat from digital alternatives, customer acquisition cost pressures, and limited room for positive surprise at current valuations.
Do you think there's more to the story for American Express? Create your own Narrative to let the Community know!
This article by Simply Wall St is general in nature. We provide commentary based on historical data and analyst forecasts only using an unbiased methodology and our articles are not intended to be financial advice. It does not constitute a recommendation to buy or sell any stock, and does not take account of your objectives, or your financial situation. We aim to bring you long-term focused analysis driven by fundamental data. Note that our analysis may not factor in the latest price-sensitive company announcements or qualitative material. Simply Wall St has no position in any stocks mentioned.
New: Manage All Your Stock Portfolios in One Place
We've created the ultimate portfolio companion for stock investors, and it's free.
• Connect an unlimited number of Portfolios and see your total in one currency
• Be alerted to new Warning Signs or Risks via email or mobile
• Track the Fair Value of your stocks
Have feedback on this article? Concerned about the content? Get in touch with us directly. Alternatively, email editorial-team@simplywallst.com
About NYSE:AXP
American Express
Operates as integrated payments company in the United States, Europe, the Middle East and Africa, the Asia Pacific, Australia, New Zealand, Latin America, Canada, the Caribbean, and Internationally.
Excellent balance sheet average dividend payer.
Similar Companies
Market Insights

Advertisement
Community Narratives
A formidable player in AI and enterprise computing.
Fair Value US$210.00|3.9% overvalued
CO
Community Contributor
IREN's Bold Moves in Sustainable Bitcoin Mining & AI Data Centers
Fair Value US$72.52|4.1% undervalued
BL
Community Contributor
Cooling the Champions: The Aussie Tech Behind F1's Victories
Fair Value AU$12.40|39.4% undervalued
TR
Community Contributor