Advertisement
- United States
- /
- Capital Markets
- /
- NasdaqGS:IBKR
How Should Investors Approach Interactive Brokers After 52.9% Year-to-Date Surge?

Simply Wall St
Reviewed by Bailey Pemberton
Thinking about what to do next with Interactive Brokers Group stock? You’re hardly alone; after all, this is a company that’s been catching investors’ attention with a powerful mix of growth and volatility. Whether you’re watching the stock climb or wondering if it’s time to jump in or take profits, it’s helpful to step back and look at what’s driven the share price lately.
Despite a minor pullback of 3.2% in the past week, Interactive Brokers remains up an impressive 12.1% over the last month. Year to date, the stock has soared 52.9%, and if you zoom out further, the one-year return reaches a striking 91.2%. Go back even farther and the growth story becomes even harder to ignore, up 272.8% over three years and a remarkable 480% over five years. Movements like these often come as shifts in market sentiment unfold, sometimes in response to broader trading volumes, competitive efforts among brokerage platforms, or underlying changes in the global market landscape.
But here’s a key point for anyone thinking about value: based on standard valuation checks, Interactive Brokers Group scores just 0 out of 6. That means the company isn’t marked “undervalued” on any of the commonly watched metrics right now, at least by those typical yardsticks.
Still, with a run-up like this, are traditional valuation models missing the bigger picture? Let’s walk through those different approaches for evaluating this stock, then explore a smarter method for judging true value at the end.
Interactive Brokers Group scores just 0/6 on our valuation checks. See what other red flags we found in the full valuation breakdown.
Approach 1: Interactive Brokers Group Excess Returns Analysis
The Excess Returns model evaluates a stock's intrinsic value by measuring how much profit the company generates beyond what investors would require as compensation for risk. This approach zeroes in on return on invested capital, focusing on the difference between the cost of equity and the company’s sustained profitability.
For Interactive Brokers Group, the figures are telling. The company’s book value stands at $10.93 per share, with an estimated stable earnings per share of $2.34, based on forecasts from five analysts. The cost of equity is $1.30 per share, resulting in an excess return, a key metric in this model, of $1.04 per share. Its average return on equity is a robust 17.59%, and projections suggest the stable book value could reach $13.31 per share in the future.
The calculated intrinsic value using the Excess Returns model lands at $28.86 per share. Compared to the current share price, this implies the stock is roughly 141.8% overvalued, indicating it is trading well above what its long-term returns would justify by this method.
Result: OVERVALUED
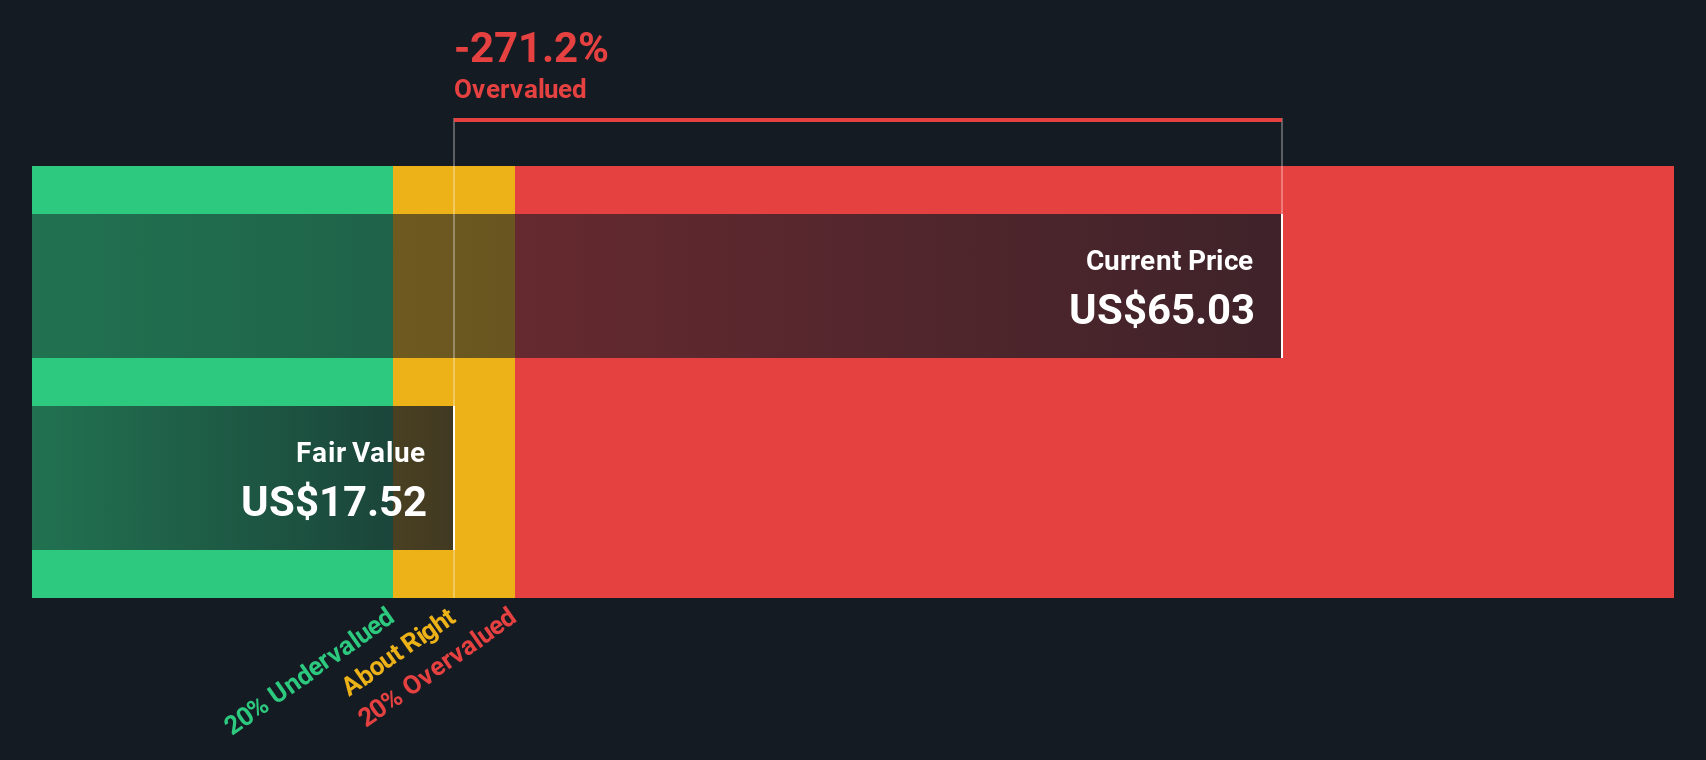
Our Excess Returns analysis suggests Interactive Brokers Group may be overvalued by 141.8%. Find undervalued stocks or create your own screener to find better value opportunities.
Approach 2: Interactive Brokers Group Price vs Earnings
The Price-to-Earnings (PE) ratio is a popular tool for evaluating profitable companies like Interactive Brokers Group because it indicates how much investors are willing to pay for a dollar of earnings. This metric is especially useful for businesses with steady profits, since it directly links share price to bottom-line performance.
Growth expectations and perceived risk play a big role in what counts as a “normal” PE. Companies with faster projected growth or lower risks often command higher PE ratios, while those seen as riskier or slower-growing typically trade at lower multiples. Therefore, context matters when comparing PE across different businesses or sectors.
Interactive Brokers is currently trading at a PE ratio of 37.1x. For comparison, the average PE for its industry is 25.7x, and its peers are averaging 31.0x. On the surface, this suggests the stock is more expensive than both its direct competitors and the broader sector.
Enter the Simply Wall St “Fair Ratio,” a proprietary benchmark that factors in not only industry dynamics and profit margins but also growth prospects, risks, market cap, and more. This makes it a more tailored and holistic assessment than just looking at industry or peer averages. For Interactive Brokers, the Fair PE Ratio has been set at 21.7x.
With the actual PE standing at 37.1x, considerably above both the peer group and its Fair Ratio, the stock comes up as expensive based on this approach.
Result: OVERVALUED
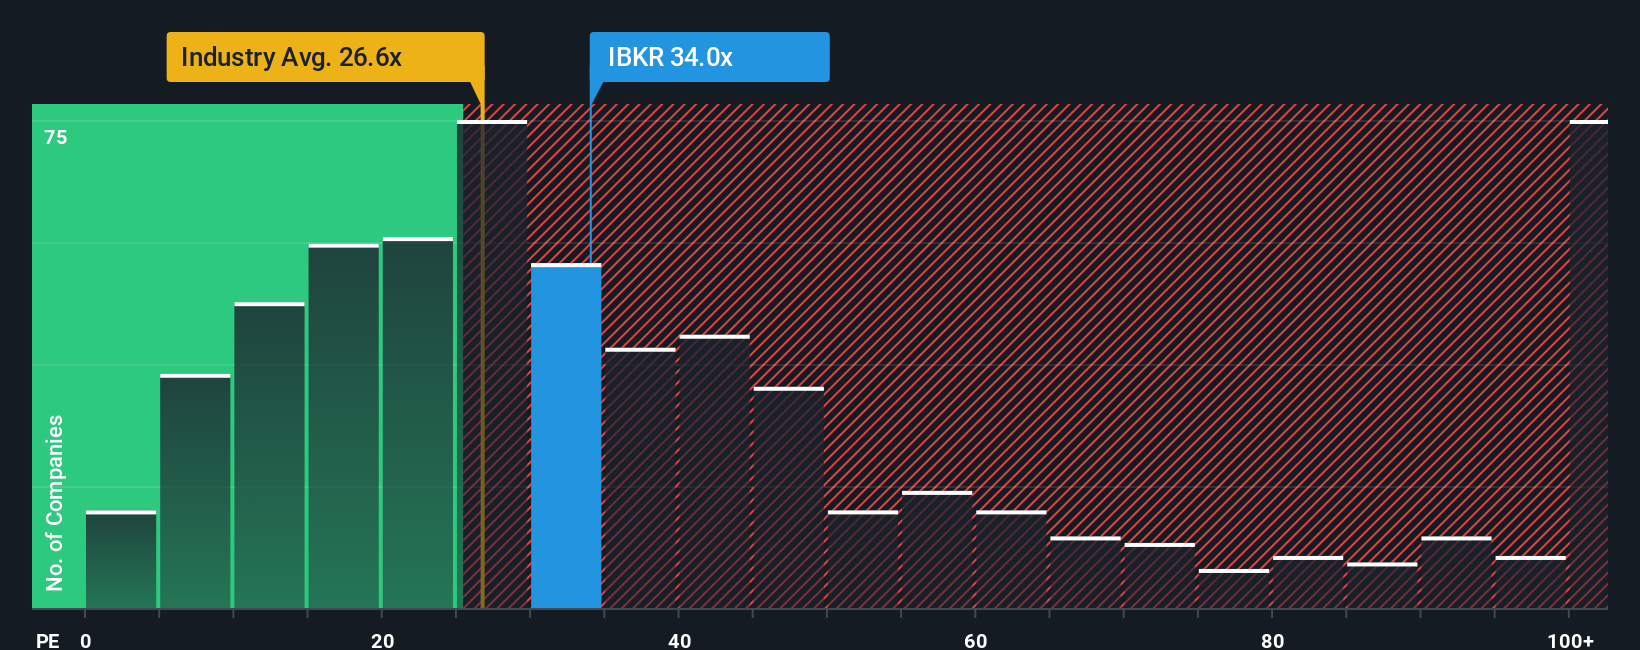
PE ratios tell one story, but what if the real opportunity lies elsewhere? Discover companies where insiders are betting big on explosive growth.
Upgrade Your Decision Making: Choose your Interactive Brokers Group Narrative
Earlier we mentioned that there's an even better way to understand valuation, so let's introduce you to Narratives. A Narrative is a clear statement of your perspective on a company, tying together your expectations about its future growth, earnings, and margins into an actual story that leads directly to your estimate of fair value.
Narratives make investing much more approachable by helping you connect what you know about a business to a concrete financial forecast, then compare your calculated fair value to the market price. This approach is simple to use on Simply Wall St's Community page, where millions of investors post, update, and discuss their Narratives for companies like Interactive Brokers Group.
As conditions change, such as new product launches, earnings reports, or shifts in trading volumes, Narratives are automatically updated, keeping your analysis relevant in real time. This lets you quickly sense check whether it's the right moment to buy, hold, or sell, based on the informed opinions and calculations of a broad community.
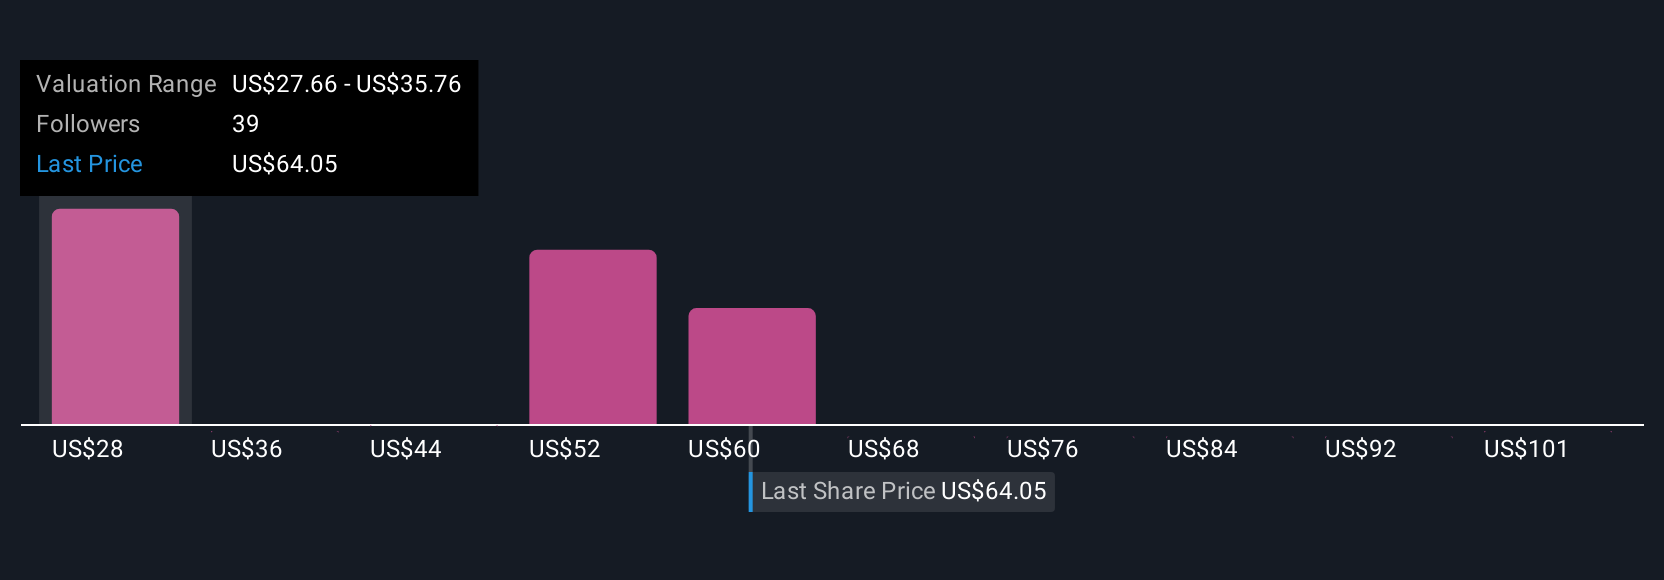
For example, some investors lately see Interactive Brokers Group’s fair value at $288.0, forecasting strong global expansion and innovation, while others are more cautious with a $140.0 target, highlighting challenges from competition and volatile trading activity. This shows just how flexible Narratives can be in reflecting different viewpoints.
Do you think there's more to the story for Interactive Brokers Group? Create your own Narrative to let the Community know!
This article by Simply Wall St is general in nature. We provide commentary based on historical data and analyst forecasts only using an unbiased methodology and our articles are not intended to be financial advice. It does not constitute a recommendation to buy or sell any stock, and does not take account of your objectives, or your financial situation. We aim to bring you long-term focused analysis driven by fundamental data. Note that our analysis may not factor in the latest price-sensitive company announcements or qualitative material. Simply Wall St has no position in any stocks mentioned.
New: AI Stock Screener & Alerts
Our new AI Stock Screener scans the market every day to uncover opportunities.
• Dividend Powerhouses (3%+ Yield)
• Undervalued Small Caps with Insider Buying
• High growth Tech and AI Companies
Or build your own from over 50 metrics.
Have feedback on this article? Concerned about the content? Get in touch with us directly. Alternatively, email editorial-team@simplywallst.com
About NasdaqGS:IBKR
Interactive Brokers Group
Operates as an automated electronic broker in the United States and internationally.
Proven track record with adequate balance sheet.
Similar Companies
Market Insights

Advertisement
Community Narratives
A formidable player in AI and enterprise computing.
Fair Value US$210.00|13.6% overvalued
CO
Community Contributor
IREN's Bold Moves in Sustainable Bitcoin Mining & AI Data Centers
Fair Value US$89.00|23.6% undervalued
BL
Community Contributor
Cooling the Champions: The Aussie Tech Behind F1's Victories
Fair Value AU$12.40|37.6% undervalued
TR
Community Contributor