- United States
- /
- Diversified Financial
- /
- OTCPK:FPAY
Not Many Are Piling Into FlexShopper, Inc. (NASDAQ:FPAY) Stock Yet As It Plummets 36%
The FlexShopper, Inc. (NASDAQ:FPAY) share price has softened a substantial 36% over the previous 30 days, handing back much of the gains the stock has made lately. The last month has meant the stock is now only up 4.6% during the last year.
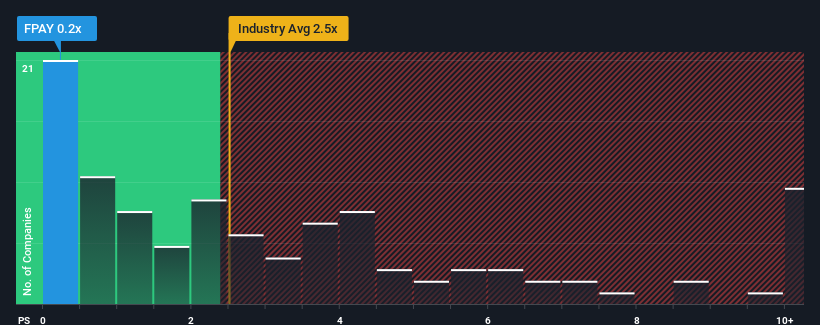
After such a large drop in price, FlexShopper may look like a strong buying opportunity at present with its price-to-sales (or "P/S") ratio of 0.2x, considering almost half of all companies in the Diversified Financial industry in the United States have P/S ratios greater than 2.5x and even P/S higher than 5x aren't out of the ordinary. Nonetheless, we'd need to dig a little deeper to determine if there is a rational basis for the highly reduced P/S.
Check out our latest analysis for FlexShopper

How Has FlexShopper Performed Recently?
FlexShopper hasn't been tracking well recently as its declining revenue compares poorly to other companies, which have seen some growth in their revenues on average. It seems that many are expecting the poor revenue performance to persist, which has repressed the P/S ratio. If you still like the company, you'd be hoping this isn't the case so that you could potentially pick up some stock while it's out of favour.
Keen to find out how analysts think FlexShopper's future stacks up against the industry? In that case, our free report is a great place to start.Is There Any Revenue Growth Forecasted For FlexShopper?
There's an inherent assumption that a company should far underperform the industry for P/S ratios like FlexShopper's to be considered reasonable.
Retrospectively, the last year delivered a frustrating 12% decrease to the company's top line. That put a dampener on the good run it was having over the longer-term as its three-year revenue growth is still a noteworthy 12% in total. So we can start by confirming that the company has generally done a good job of growing revenue over that time, even though it had some hiccups along the way.
Turning to the outlook, the next year should generate growth of 24% as estimated by the three analysts watching the company. With the industry only predicted to deliver 1.7%, the company is positioned for a stronger revenue result.
With this in consideration, we find it intriguing that FlexShopper's P/S sits behind most of its industry peers. It looks like most investors are not convinced at all that the company can achieve future growth expectations.
What Does FlexShopper's P/S Mean For Investors?
FlexShopper's P/S looks about as weak as its stock price lately. Generally, our preference is to limit the use of the price-to-sales ratio to establishing what the market thinks about the overall health of a company.
To us, it seems FlexShopper currently trades on a significantly depressed P/S given its forecasted revenue growth is higher than the rest of its industry. When we see strong growth forecasts like this, we can only assume potential risks are what might be placing significant pressure on the P/S ratio. It appears the market could be anticipating revenue instability, because these conditions should normally provide a boost to the share price.
You should always think about risks. Case in point, we've spotted 4 warning signs for FlexShopper you should be aware of, and 1 of them is a bit unpleasant.
If companies with solid past earnings growth is up your alley, you may wish to see this free collection of other companies with strong earnings growth and low P/E ratios.
Mobile Infrastructure for Defense and Disaster
The next wave in robotics isn't humanoid. Its fully autonomous towers delivering 5G, ISR, and radar in under 30 minutes, anywhere.
Get the investor briefing before the next round of contracts
Sponsored On Behalf of CiTechNew: AI Stock Screener & Alerts
Our new AI Stock Screener scans the market every day to uncover opportunities.
• Dividend Powerhouses (3%+ Yield)
• Undervalued Small Caps with Insider Buying
• High growth Tech and AI Companies
Or build your own from over 50 metrics.
Have feedback on this article? Concerned about the content? Get in touch with us directly. Alternatively, email editorial-team (at) simplywallst.com.
This article by Simply Wall St is general in nature. We provide commentary based on historical data and analyst forecasts only using an unbiased methodology and our articles are not intended to be financial advice. It does not constitute a recommendation to buy or sell any stock, and does not take account of your objectives, or your financial situation. We aim to bring you long-term focused analysis driven by fundamental data. Note that our analysis may not factor in the latest price-sensitive company announcements or qualitative material. Simply Wall St has no position in any stocks mentioned.
About OTCPK:FPAY
FlexShopper
A financial technology company, operates an e-commerce marketplace to shop electronics, home furnishings, and other durable goods on a lease-to-own (LTO) basis.
Slight risk and slightly overvalued.
Market Insights
Weekly Picks

THE KINGDOM OF BROWN GOODS: WHY MGPI IS BEING CRUSHED BY INVENTORY & PRIMED FOR RESURRECTION


Why Vertical Aerospace (NYSE: EVTL) is Worth Possibly Over 13x its Current Price


The Quiet Giant That Became AI’s Power Grid
Recently Updated Narratives


A tech powerhouse quietly powering the world’s AI infrastructure.


Keppel DC REIT (SGX: AJBU) is a resilient gem in the data center space.


Why Vertical Aerospace (NYSE: EVTL) is Worth Possibly Over 13x its Current Price
Popular Narratives


MicroVision will explode future revenue by 380.37% with a vision towards success


Crazy Undervalued 42 Baggers Silver Play (Active & Running Mine)


