Advertisement
- United States
- /
- Hospitality
- /
- NYSE:VIK
Is This a Good Entry Point for Viking Holdings After Surging 65% This Year?

Simply Wall St
Reviewed by Simply Wall St

Wondering whether now is the right time to take a closer look at Viking Holdings? You are certainly not alone. Investors have been watching the company’s share price swing over the past few months with a mix of anticipation and curiosity. After all, Viking Holdings is up an impressive 65% over the past year and more than 35% just since the start of 2024. This strong performance has put it on the radar for anyone looking for growth stories with genuine staying power. Even after a bit of choppiness in the last week, there is a sense that the market could be re-rating Viking based on shifting growth prospects and updated risk appetite.
Looking more closely at the fundamentals, Viking’s valuation score comes in at 3 out of 6. This reflects that it appears undervalued in half of the most important metrics analysts monitor. With the stock most recently closing at $59.22—close to, but not above, Wall Street’s average price target—it is natural for investors to wonder how much opportunity remains and whether the risk profile has changed. Every metric tells a different story, and sometimes the numbers do not capture the full picture.
Let’s break down exactly how Viking’s value stacks up under classic approaches and explore why savvy investors might want to look beyond traditional scorecards before making a move.
Viking Holdings delivered 64.8% returns over the last year. See how this stacks up to the rest of the Hospitality industry.Approach 1: Viking Holdings Cash Flows
A Discounted Cash Flow (DCF) model estimates what a company is worth today by projecting future cash flows and then discounting them back to their present value. This method helps investors judge whether a company's shares are trading above or below their intrinsic value.
Viking Holdings reported Free Cash Flow (FCF) of approximately $1.15 billion over the last twelve months. Analyst projections indicate robust growth, with estimates showing annual FCF rising steadily to about $4.8 billion by 2035. These forecasts incorporate assumptions about recurring business growth, future investments, and changing market conditions over the next decade.
Based on the DCF model using these projections, Viking Holdings’ estimated fair value is $128.31 per share. With the current share price at $59.22, the calculation suggests the stock is about 53.8% undervalued relative to its intrinsic worth.
For investors, this indicates a significant potential gap between what the market is paying now and what the business could be worth if cash flows remain on track.
Result: UNDERVALUED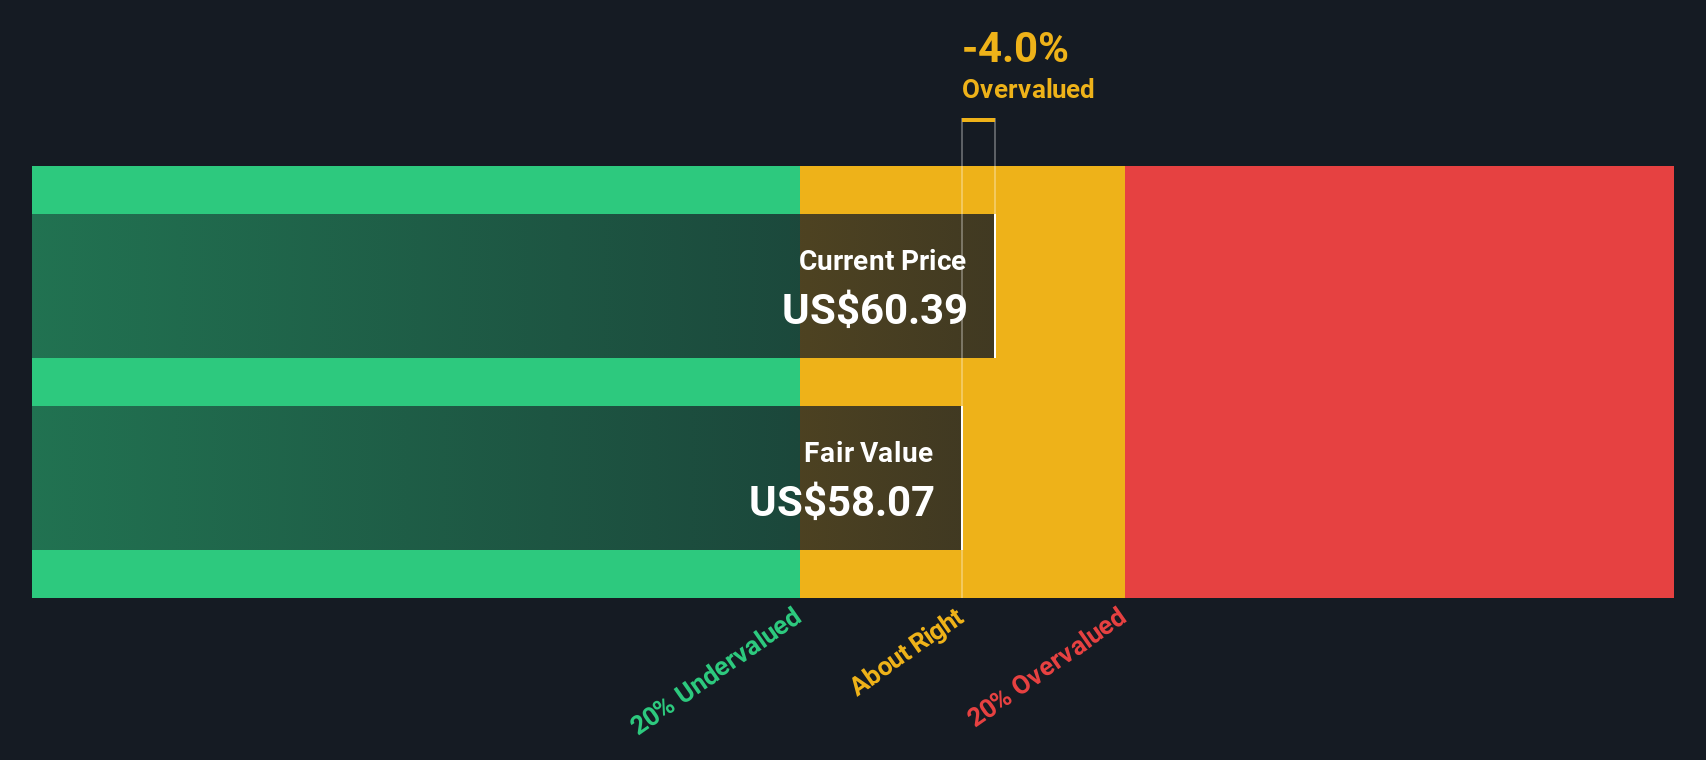
Approach 2: Viking Holdings Price vs Earnings
The Price-to-Earnings (PE) ratio is widely considered a solid benchmark for valuing profitable companies like Viking Holdings. This metric helps investors gauge how much they are paying for each dollar of earnings, making it particularly relevant when the business generates consistent profits.
A company’s "normal" PE ratio is influenced by its expected earnings growth and perceived risk. Higher growth typically leads to a higher PE, while greater risks may push it lower. Essentially, investors weigh how much future expansion or uncertainty they are factoring into today’s share price.
Viking Holdings is trading at a PE ratio of 32.9x. This is considerably above the Hospitality industry average of 23.1x and its listed peer average of 21.8x, suggesting the market already places a premium on Viking’s future prospects. However, there is another factor to consider: Simply Wall St’s proprietary Fair Ratio, which adjusts for growth, profitability, and risk, currently stands at 37.9x for Viking Holdings.
Comparing the actual PE and Fair Ratio, Viking’s shares are priced just below the level justified by its fundamentals. This indicates that, on an earnings multiple basis, the stock is not unreasonably valued and may even be trading at a modest discount.
Result: UNDERVALUED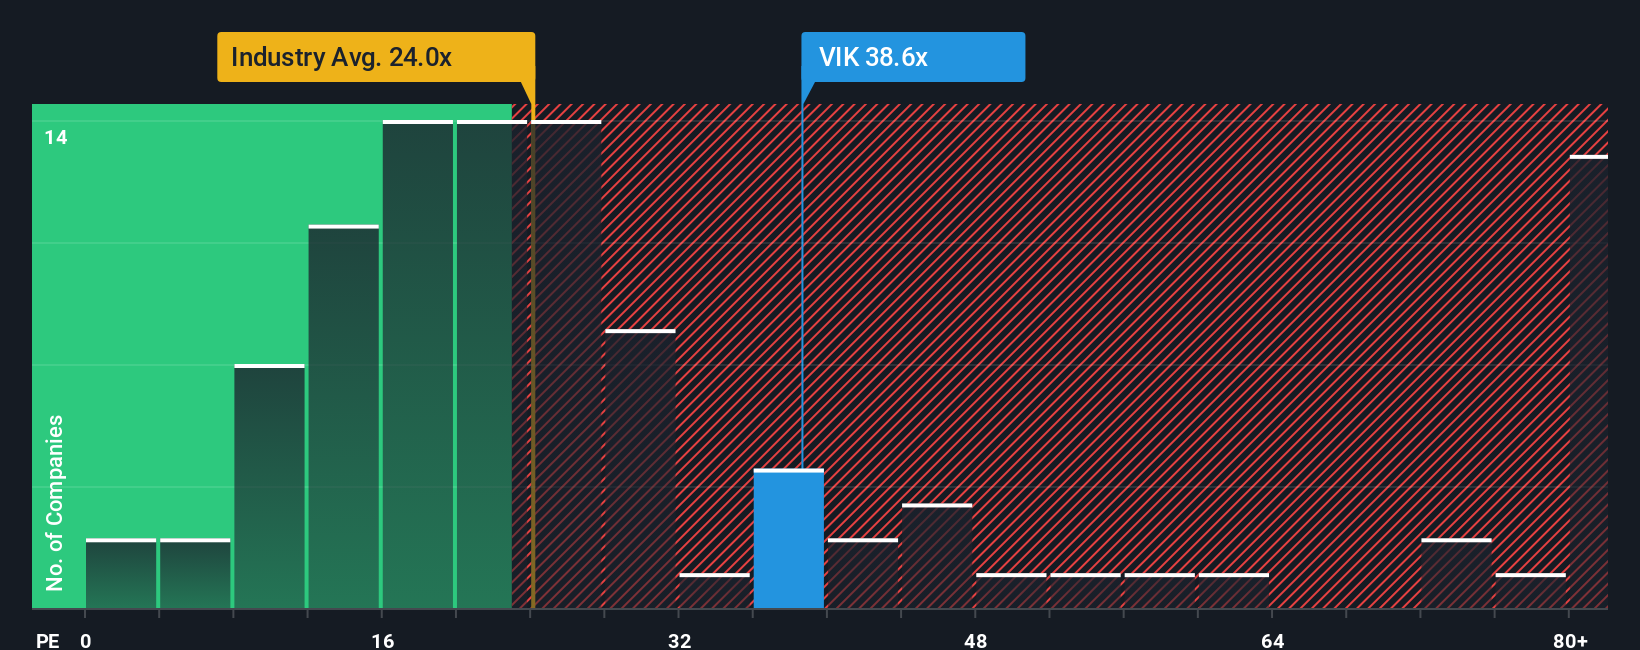
Upgrade Your Decision Making: Choose your Viking Holdings Narrative
A Narrative is simply your story and perspective about Viking Holdings. It connects what you believe about its future—such as revenue, earnings, and margins—to a financial forecast and ultimately to a fair value for the shares. Narratives turn investing from a numbers-only process into one that incorporates your insights and the big picture, helping you better understand how the company's fundamentals and future events might affect its value.
Within Simply Wall St, Narratives are an easy, interactive way for millions of investors to create, share, and update their own views about a business. This makes it simple to compare your convictions to others and to professional analyses. By comparing the Fair Value in your Narrative with today’s share price, you can quickly see if the stock appears over- or underpriced for your specific outlook, and decide if it’s time to buy, hold, or sell.
Narratives are kept up to date as new information, such as earnings announcements or major news, arrives so your analysis always reflects the latest developments. For example, one investor might take an optimistic Narrative and project fair value up to $82 per share based on strong long-term growth. Another investor with a cautious view might believe the true value is closer to $46, illustrating how your individual perspective can make a real difference in investment decisions.
Do you think there's more to the story for Viking Holdings? Create your own Narrative to let the Community know!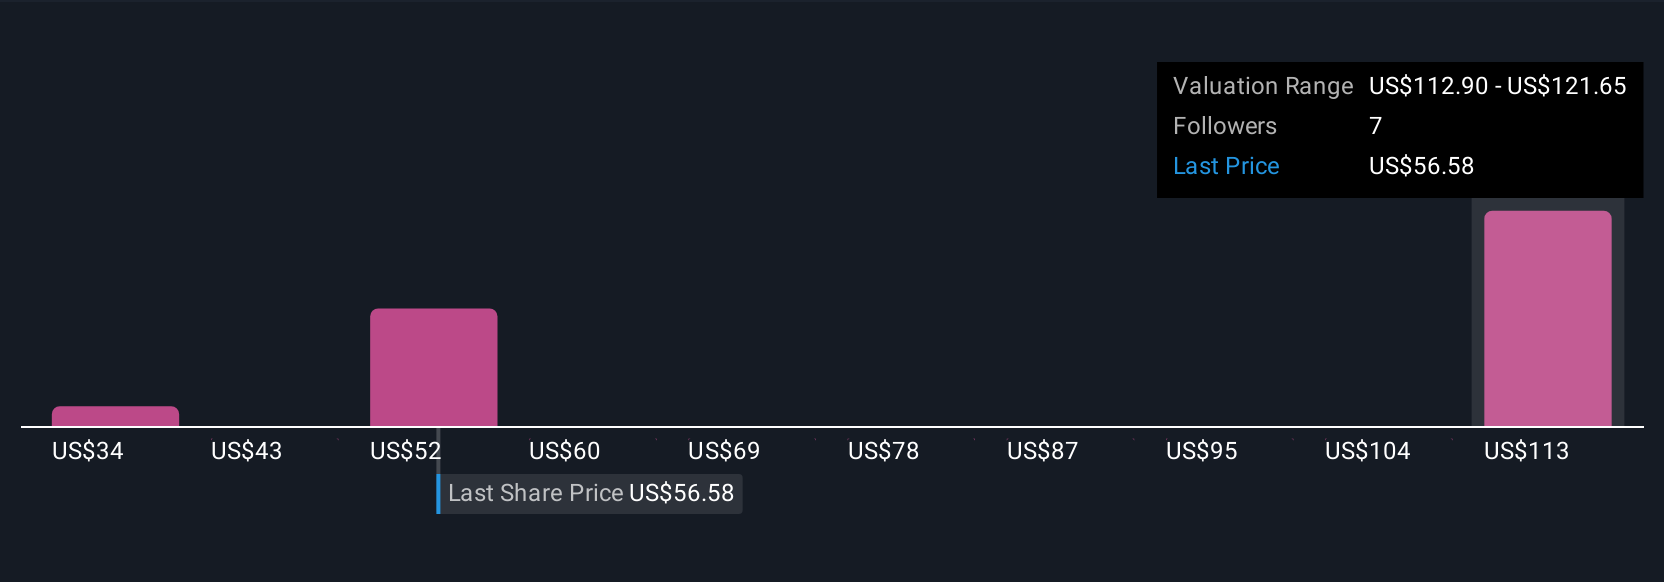
This article by Simply Wall St is general in nature. We provide commentary based on historical data and analyst forecasts only using an unbiased methodology and our articles are not intended to be financial advice. It does not constitute a recommendation to buy or sell any stock, and does not take account of your objectives, or your financial situation. We aim to bring you long-term focused analysis driven by fundamental data. Note that our analysis may not factor in the latest price-sensitive company announcements or qualitative material. Simply Wall St has no position in any stocks mentioned.
New: Manage All Your Stock Portfolios in One Place
We've created the ultimate portfolio companion for stock investors, and it's free.
• Connect an unlimited number of Portfolios and see your total in one currency
• Be alerted to new Warning Signs or Risks via email or mobile
• Track the Fair Value of your stocks
Have feedback on this article? Concerned about the content? Get in touch with us directly. Alternatively, email editorial-team@simplywallst.com
About NYSE:VIK
Viking Holdings
Engages in the passenger shipping and other forms of passenger transport in North America, the United Kingdom, and internationally.
High growth potential with acceptable track record.
Similar Companies
Market Insights


Advertisement
Community Narratives
Gaxos.ai: Early-Stage AI Innovator in Gaming & Health
Fair Value US$2.21|17.6% undervalued
JO
Community Contributor
After the AI Party: A Sobering Look at Microsoft's Future
Fair Value US$500.00|1.1% overvalued
PI
Community Contributor
Amazon's Future Rises as Stock Price Falls: A Long-Term Investment Vision
Fair Value US$234.75|4.7% undervalued
ZW
Community Contributor
