Advertisement
- United States
- /
- Hospitality
- /
- NasdaqGS:TCOM
Is Trip.com Group (NasdaqGS:TCOM) Pricing Look Interesting After Strong Multi‑Year Share Gains?

Simply Wall St
Reviewed by Bailey Pemberton
- If you are wondering whether Trip.com Group is priced attractively right now, this article walks through what the latest numbers suggest about the stock's value.
- Over the recent period, the share price closed at US$75.66, with returns of 1.6% over 7 days, 6.8% over 30 days, 1.6% year to date, 20.4% over 1 year, 102.5% over 3 years and 129.4% over 5 years.
- Recent moves in travel and online booking names have kept Trip.com Group on many investors' watchlists, as the sector continues to react to shifts in travel demand and digital booking habits. These trends provide useful context when you think about what you might be paying for each dollar of the company's future cash flows or earnings.
- On Simply Wall St's valuation checks, Trip.com Group has a value score of 5 out of 6, which suggests several traditional metrics point to potential undervaluation. We will look at those methods next, before finishing with a more complete way to think about what the stock could be worth.
Approach 1: Trip.com Group Discounted Cash Flow (DCF) Analysis
A Discounted Cash Flow model takes estimates of a company’s future cash flows and discounts them back to today, to arrive at an estimate of what the business may be worth now.
For Trip.com Group, the latest twelve month free cash flow is CN¥19,022.50m. Analysts have supplied free cash flow estimates for several years ahead, and Simply Wall St then extends those projections further using its own assumptions. Under this 2 Stage Free Cash Flow to Equity model, free cash flow is projected to reach CN¥29,000.00m in 2030.
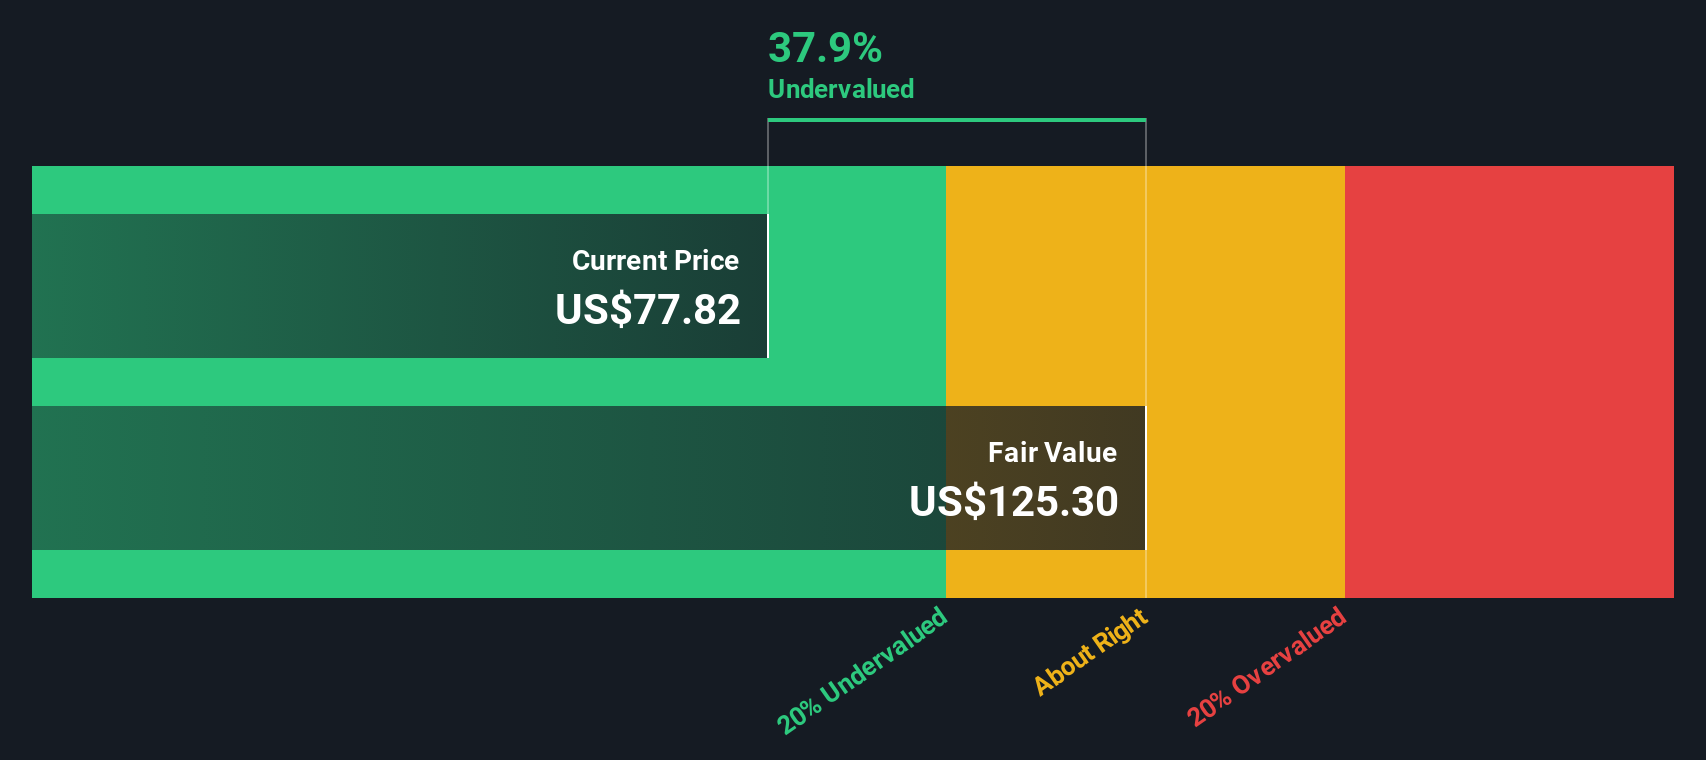
All of these projected cash flows, expressed in CN¥, are discounted back to today and summed, which gives an estimated intrinsic value of US$125.27 per share. Compared to the recent share price of US$75.66, the model implies a 39.6% discount, which indicates that Trip.com Group is trading below this DCF estimate.
Result: UNDERVALUED
Our Discounted Cash Flow (DCF) analysis suggests Trip.com Group is undervalued by 39.6%. Track this in your watchlist or portfolio, or discover 879 more undervalued stocks based on cash flows.
Approach 2: Trip.com Group Price vs Earnings
For profitable companies, the P/E ratio is a useful way to think about what you are paying for each dollar of current earnings. It links the share price directly to the business’s profit, which is usually more stable than short term revenue or book value.
What counts as a “normal” P/E depends on how the market views growth prospects and risk. Higher expected growth and lower perceived risk can support a higher multiple, while slower expected growth or higher risk usually comes with a lower one.
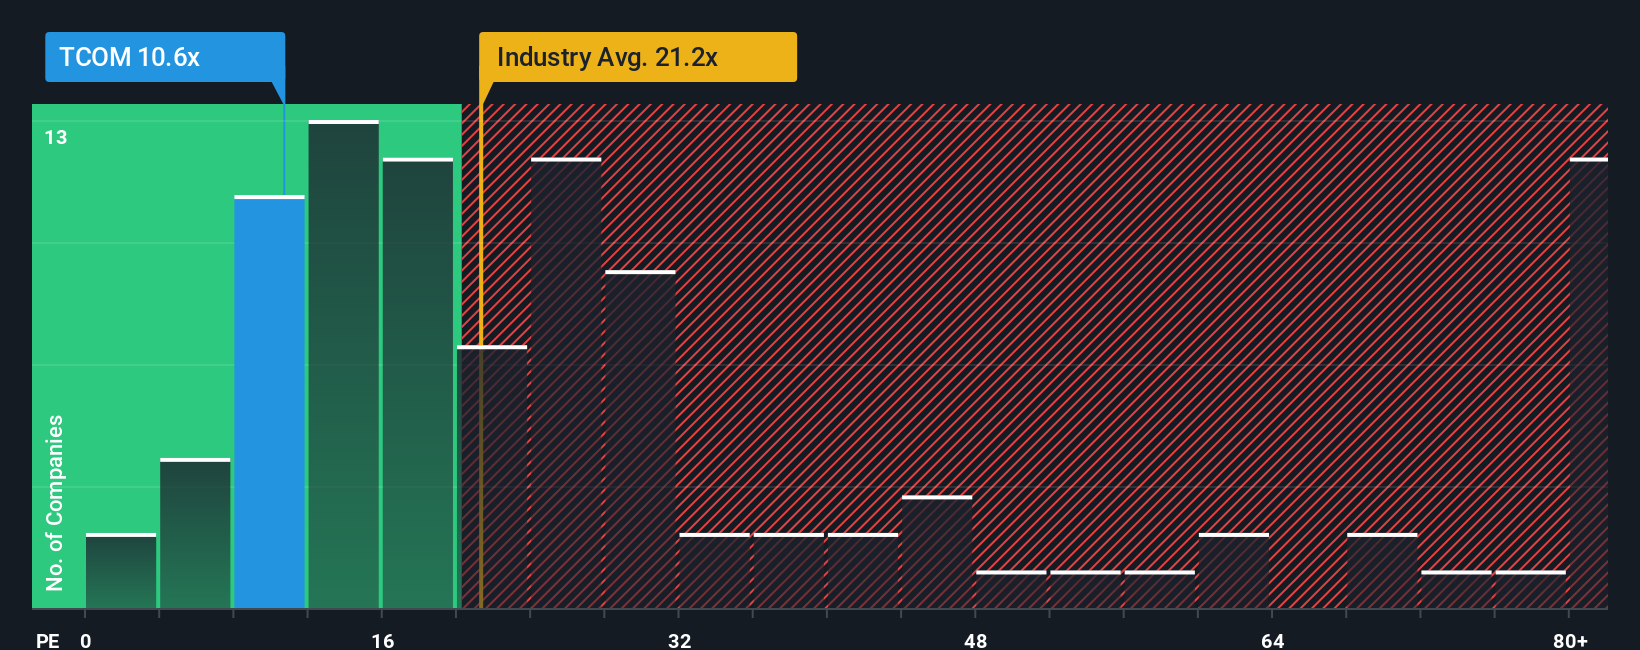
Trip.com Group currently trades on a P/E of 11.07x. That sits below the Hospitality industry average of 22.33x and the peer group average of 28.04x. Simply Wall St also calculates a proprietary “Fair Ratio” for the P/E, which attempts to estimate the multiple that fits Trip.com Group given its earnings growth profile, margins, industry, market cap and risk factors. For Trip.com Group, this Fair Ratio is 13.07x.
This Fair Ratio can be more useful than a plain comparison with peers or the sector, because it adjusts for company specific characteristics rather than assuming all Hospitality stocks deserve the same P/E. With the current 11.07x P/E sitting below the 13.07x Fair Ratio, the shares screen as undervalued on this measure.
Result: UNDERVALUED
P/E ratios tell one story, but what if the real opportunity lies elsewhere? Discover 1444 companies where insiders are betting big on explosive growth.
Upgrade Your Decision Making: Choose your Trip.com Group Narrative
Earlier we mentioned that there is an even better way to understand valuation, and that is through Narratives. These are simply your story about Trip.com Group, linked to your own forecast for its future revenue, earnings, margins and fair value, then compared to today’s price to help you judge whether it looks attractive or not.
On Simply Wall St’s Community page, Narratives are an easy, visual tool used by millions of investors. Your view of the company’s business drivers is turned into a financial forecast and a fair value estimate that automatically refreshes when new earnings, news or other updates are added to the platform.
For Trip.com Group, one investor might build a Narrative that assumes strong overseas holiday demand continues and points to a fair value close to US$97.36. Another might focus more on competition and regulatory risks and land nearer US$70.26. By comparing each Narrative’s fair value with the current share price, both investors get a clear, consistent way to decide whether they see the stock as appealing right now or not.
Do you think there's more to the story for Trip.com Group? Head over to our Community to see what others are saying!

This article by Simply Wall St is general in nature. We provide commentary based on historical data and analyst forecasts only using an unbiased methodology and our articles are not intended to be financial advice. It does not constitute a recommendation to buy or sell any stock, and does not take account of your objectives, or your financial situation. We aim to bring you long-term focused analysis driven by fundamental data. Note that our analysis may not factor in the latest price-sensitive company announcements or qualitative material. Simply Wall St has no position in any stocks mentioned.
Valuation is complex, but we're here to simplify it.
Discover if Trip.com Group might be undervalued or overvalued with our detailed analysis, featuring fair value estimates, potential risks, dividends, insider trades, and its financial condition.
Access Free AnalysisHave feedback on this article? Concerned about the content? Get in touch with us directly. Alternatively, email editorial-team@simplywallst.com
About NasdaqGS:TCOM
Trip.com Group
Through its subsidiaries, operates as a travel service provider for accommodation reservation, transportation ticketing, packaged tours, in-destination, corporate travel management, and other travel-related services in China and internationally.
Flawless balance sheet and undervalued.
Similar Companies
Market Insights


Advertisement
Weekly Picks
WE


WealthAP on PayPal Holdings ·
The "Sleeping Giant" Stumbles, Then Wakes Up
Fair Value:US$8229.7% undervalued
47 followersusers have followed this narrative
4 commentsusers have commented on this narrative
28 likesusers have liked this narrative
WO

woodworthfund on Bumble ·
Swiped Left by Wall Street: The BMBL Rebound Trade
Fair Value:US$961.3% undervalued
15 followersusers have followed this narrative
0 commentsusers have commented on this narrative
6 likesusers have liked this narrative
WE

WealthAP on Duolingo ·
Duolingo (DUOL): Why A 20% Drop Might Be The Entry Point We've Been Waiting For
Fair Value:US$268.6434.2% undervalued
31 followersusers have followed this narrative
5 commentsusers have commented on this narrative
8 likesusers have liked this narrative
Recently Updated Narratives
YI

yiannisz on Alphabet ·
The Real Power Behind Alphabet’s Growth
Fair Value:US$192.5470.7% overvalued
22 followersusers have followed this narrative
1 commentusers have commented on this narrative
0 likesusers have liked this narrative
YI

yiannisz on RELX ·
RELX: The Quiet Compounder Powering Law, Science, and Risk Intelligence
Fair Value:US$41.224.7% overvalued
1 followerusers have followed this narrative
0 commentsusers have commented on this narrative
0 likesusers have liked this narrative
YI

yiannisz on CVS Health ·
Why CVS’s Valuation Signals Opportunity
Fair Value:US$104.0122.8% undervalued
102 followersusers have followed this narrative
9 commentsusers have commented on this narrative
0 likesusers have liked this narrative
Popular Narratives
AG


Agricola on Excellon Resources ·
A case for CA$31.80 (undiluted), aka 8,616% upside from CA$0.37 (an 86 bagger!).
Fair Value:CA$31.898.3% undervalued
70 followersusers have followed this narrative
13 commentsusers have commented on this narrative
23 likesusers have liked this narrative
AN


AnalystConsensusTarget on NVIDIA ·
NVDA: Expanding AI Demand Will Drive Major Data Center Investments Through 2026
Fair Value:US$253.0227.0% undervalued
1030 followersusers have followed this narrative
6 commentsusers have commented on this narrative
29 likesusers have liked this narrative
AL

AlexLovell on Rocket Lab ·
Early mover in a fast growing industry. Likely to experience share price volatility as they scale
Fair Value:US$16.25422.1% overvalued
73 followersusers have followed this narrative
1 commentusers have commented on this narrative
18 likesusers have liked this narrative